
The Capability Matrix · the benchmark behind the scores
Independent benchmarks. Code in the open
You've read the benchmark slide where the vendor's engine wins by 40× and there's no way to check. Every number on this page runs the other way: methodology public, code public, corpus synthetic — clone the repo and re-run it on your own hardware before you believe me. The flagship finding is two-regime, and I publish both halves: the schema-on-read index wins the simple indexed lookups, and the lakehouse engines win the hunting-shaped aggregations by 5–62× (Tier B, single host, 10M events, CV-gated, identical answers verified).
These benchmarks are the hard evidence behind the Capability Matrix scores, one product with the lab as its measurement engine. They feed the open research notebook, where each measured result becomes a tracked hypothesis with an evidence tier and a record of what would change the answer.
What's below is twenty-two first-party benchmarks — five published and seventeen shipping as a first pass, plus an FSI compliance human-hours study scaffolded and a Vortex-vs-Parquet test install-blocked — twenty-one of them with public code you can clone and re-run and one held under NDA because its comparison set includes commercial software whose licensing restricts publishing the results. The first nine are written up in full and thirteen more in brief with their code, all in the selector below. These are measurements I ran behind the claims on this site, not other people's numbers I'm pointing at.
The stack, measured together
MOAR stack benchmarks.
Most of the benchmarks on this page measure one open stack from different angles: the same object storage, Iceberg table, swappable catalogs and engines, and OCSF routing the MOAR architecture describes. Taken together they answer one question, whether the architecture actually runs and whether its numbers survive checking. The stack-level results:
| What's measured | Result |
|---|---|
| Engine answer-equality | Five engines (DuckDB, Trino, ClickHouse, StarRocks, Dremio), three catalogs (Iceberg REST, Nessie, Lakekeeper), and two table formats (Iceberg, DuckLake) return the identical answer (1,000 rows / 125 RDP) over the same data. |
| Reader correctness | Two of thirteen Parquet readers returned a wrong count with no error or warning on a file the others read correctly, which is why answer-equality runs as a standing gate rather than a one-time test. |
| Query speed vs. SIEM | Two-regime: the lakehouse engines ran the hunting-shaped aggregations on a 10M-event Zeek workload 5–62× faster than a schema-on-read SIEM (46.8× native / 10.1× Iceberg on the five-query average, single-node Tier B), and the index wins the simple lookups, detailed below. |
| Compression | 9.0× under ClickHouse blanket ZSTD-22 on the pinned 10M-event Zeek corpus; Iceberg Parquet lands 8.5× against raw JSONL on the same corpus, the anchor for the calculator below. |
| Storage vs. SIEM | About 7× smaller than an OpenSearch index on identical OCSF data, answers identical (1.6 vs 11.5 MB at 200,000 events). |
| Query latency | 4 to 14 ms at a million rows on a single host across the gated workloads. |
| Cross-tool data health | The best single source of record recovers 47.7% of an environment's true state; a freshness-and-authority merge across tools reaches 75.6%, and the residual 24.4% is the blind spot no tool covers (both reproducible across 12 seed re-draws, CV 0.3%). |
| Normalization fidelity | Routine SOC queries hold under coarse normalization (+0.000); the adversary-relevant tail degrades far more — +0.188 on the de-gamed run against real MITRE APT29 telemetry with unmodified SigmaHQ rules (the adversary tail's recall-loss is ~2× that of routine queries, 0.35 vs 0.16), and a larger +0.719 on the gameable synthetic testbed — because coarsening discards the evidence those queries need. |
| Chain of custody | Iceberg time-travel returns the exact state as of each immutable snapshot, the lineage a mutable SIEM index can't give you (Reg SCI / SEC 17a-4(f) grade). |
Single-host, first-party measurements throughout, several on synthetic but controlled testbeds and graded Tier B (reproducible, first-party); read latency and throughput as architecture rather than cluster-scale promises, since the scale sweeps are separate lab work. The consolidated write-up sits on the MOAR proof page.
The benchmarks, one at a time
Nine full write-ups, thirteen more in brief
Pick one from the list — each opens its write-up: the workload, the numbers, the caveats, and the code or PDF to re-run it yourself. The nine full write-ups come first, then thirteen first-pass results. The flagship Zeek result is open by default.
Published benchmark
On a 10M-event Zeek workload, the finding is two-regime: the index wins the simple lookups, and the lakehouse engines win the hunting-shaped aggregations by 5–62×.
Identical workload (10M Zeek conn.log events), identical hardware, identical queries. Methodology and code published; reproducible on commodity hardware.
The headline numbers.
Two regimes, reported both ways: a schema-on-read index wins the simple indexed lookups (protocol distribution, long-duration connections), and the lakehouse engines win the hunting-shaped aggregations by 5–62×, averaging 46.8× native and 10.1× over Iceberg across the five-query suite (Tier B, single host, 10M events, CV-gated, identical answers verified). The baseline is OpenSearch 2.18.0; the per-query spread behind the band is top-source-IPs 21× and port-scan 62× on ClickHouse native MergeTree, 5.4× and 14× on ClickHouse-over-Iceberg, while the index takes protocol-distribution 3.4× and long-duration 1.8× over native. Text search is the index's other regime, and a follow-up bench shows even that splits three ways: ClickHouse's full-text index ties OpenSearch on whole-token filtering, the inverted index wins substring-within-a-token, but the columnar engine is the correct one for regex over token-spanning content like base64, where the analyzer's tokenization fragments the value and the index silently undercounts (it returned 3,159 of 7,946 planted blobs while the columnar scan returned all of them). Seven trials per query throughout. ClickHouse's columnar store under blanket ZSTD-22 lands a 9.0× reduction against the raw JSON on the pinned 10M-event Zeek corpus — the columnar layout and the codec together rather than the codec alone. The schema-on-read SIEM's compressed footprint on the same data is roughly 2,385 MB, a 1.4× factor.
The scaling profile is informative. On the early single-query benchmark the schema-on-read SIEM ran 3.47 seconds at 1M events and 27.52 seconds at 10M events — an 8× latency increase for 10× the data, worse than linear, while ClickHouse stayed sub-second. (The CV-gated five-query re-run summarized below is the rigorous headline; the worse-than-linear scaling is the durable point here.) The performance gap widens as data volume grows, which is the opposite of the direction per-GB-ingested licensing models need it to scale.
The workload.
Zeek conn.log is the per-connection network telemetry record produced by the Zeek (formerly Bro) network security monitor — one of the most common high-volume security data formats in production SOCs. The benchmark loads 10 million conn.log events with realistic field distributions, spread across the standard analytical workload shape: time-bucketed aggregation, top-talker queries, protocol analysis, distinct-host counts, and a cross-source JOIN with simulated SIEM alerts.
Five queries, ten iterations each for statistical stability. Hardware: single-node Docker Compose on WSL2, 32 GB RAM, 16 cores. Both engines configured identically — same row counts, same memory limits, same query suite, same iteration count. No per-tool tuning was applied beyond the documentation defaults for either side.
Reproducibility.
The benchmark repository contains: Docker Compose definitions for ClickHouse, the schema-on-read SIEM, and the additional engines tested (Trino, Dremio, StarRocks); data generation scripts that reproduce the Zeek conn.log distribution; the Python query runner; the methodology document; the analysis JSON.
Reproducibility isn't a marketing line. The repository is shared under NDA with engagement prospects and qualifying reviewers; running it on your hardware should land within statistical variance of the published numbers. If it doesn't, the discrepancy is a contribution to my understanding and gets folded into a result update with the new evidence. The reference implementation isn't published publicly because the comparison set includes commercial software whose licensing terms restrict third-party publication of comparative test results — a constraint I respect rather than work around.
Download
The methodology PDF
Hardware spec, workload definition, query suite, scaling profile, statistical-confidence detail, and the documented caveats for where the result generalizes and where it doesn't. v1.0, 2026-05. Roughly ~5 pages, no email gate.
Download methodology (PDF) →For NDA-gated reference-implementation access (Docker Compose, data generators, query runner) — book a discovery call or email jeremy@securitydataworks.com with subject Benchmark NDA request.
Published benchmark · no. 2
Flattening OCSF logs into fixed columns silently breaks the detections that catch intruders.
A reproducible measurement of three flattening failure modes, run over a lossy schema and a fidelity-preserving one on deterministic synthetic corpora. Unlike the ClickHouse benchmark above, there is no commercial software in the comparison, so the code is fully public with no NDA gate.
The three results.
Each mode plants a known ground truth, then runs the same detection logic twice: once over the schema a cost-pressured pipeline actually produces, and once over a schema that preserves the structure. The gap between the two is the flattening tax, measured rather than asserted.
| Failure mode | Lossy schema | Preserved |
|---|---|---|
| Absence→NULL: privilege-escalation recall | 0.00 | 1.00 |
| Grain loss: beacon-hunt F1 | 0.50 | 1.00 |
| Floating time: cross-zone correlation recall | 0.46–0.50 | 1.00 |
The absence case is the structural one. CloudTrail encodes "no MFA" as the absence of mfaAuthenticated, so flattening it to a column makes absence and NULL the same byte, and the naive translation WHERE mfa = 'false' recovers none of the planted privilege escalations: zero of 14,140 at a hundred thousand events. The preserved schema recovers all of them. The same bug from the flattening essay's opening case study, reproduced as a measurement.
The grain result is the asymmetry the essay predicted: a five-minute rollup answers volumetric routine queries (bytes per host, connection counts) exactly while losing the inter-arrival timing a beacon hunt depends on, so a benign bursty decoy and a real beacon become indistinguishable and F1 halves. The floating-timestamp result is the quiet one, where the cross-zone half of a correlation set silently falls outside the window while the same-zone half still looks right.
What this is, and what it isn't.
This is a Tier-B result: reproducible, first-party, controlled. It is also synthetic, and not a production claim. The corpus is built to isolate one mechanism at a time, so the corpus is the argument, and two of the three magnitudes are corpus parameters rather than universal constants — the grain F1 scales with the decoy-to-beacon ratio, and the floating-time recall tracks the cross-zone fraction. The methodology document says so plainly. The absence result is the one that is structural enough to quote without that hedge. The preserved store uses DuckDB's JSON functions to stand in for Iceberg V3's Variant type, which is the production answer the essay recommends, so DuckDB is the local reproducible analog, not the deployment target.
Run it yourself
Clone, install, run — no email gate, no NDA.
The full harness, the deterministic corpus generators, the detection queries, the per-scale results, and the methodology with its caveats are public. The suite verifies its own determinism — it runs twice and checks the output is byte-identical — before it prints a number.
View the benchmark on GitHub →DuckDB 1.5.3, fixed seed. The reasoning behind the result is in Flattening away your detection logic.
Published benchmark · no. 3
ClickHouse and DuckDB return identical answers on the same OCSF data, and the speed gap is modest.
The site argues elsewhere that over an open format the query engine is interchangeable, and that swapping it is a library change rather than a migration. This puts a number under that: the same OCSF-shaped event corpus queried by both DuckDB and embedded ClickHouse, the identical SQL run against each, and the answers checked engine-against-engine before any clock starts. There is no commercial software in the comparison, so like the flattening benchmark it is fully public.
Ten million OCSF events, each engine's native store.
Five queries a SOC actually runs, from a full-scan rollup to a selective single-user time-window lookup, timed as medians after warmup. The answers matched on both engines for every one of them.
| Query | DuckDB ms | ClickHouse ms | Faster |
|---|---|---|---|
| Full-scan rollup (count + bytes by class/activity) | 47.3 | 61.6 | DuckDB 1.3× |
| Top-20 talkers (high-cardinality group-by) | 290.9 | 588.5 | DuckDB 2.0× |
| Selective lookup (one user, six-hour window) | 12.6 | 17.2 | DuckDB 1.4× |
| Time-bucketed rate (5-minute buckets) | 48.0 | 41.7 | ClickHouse 1.2× |
| Failed-auth burst (filter + group + having) | 23.2 | 43.7 | DuckDB 1.9× |
Every query returned identical rows on both engines, in both the query-the-file-in-place and native-store configurations, at one million events and at ten. That is the half of the interchangeability claim that has to be true, and it held: four of the five queries are byte-identical SQL across the two engines, and the fifth differs by a single token, DuckDB's // against ClickHouse's intDiv. The latencies traded by query shape and the gaps stayed modest, no wider than about 2.6×, with DuckDB generally ahead at this single-node scale and ClickHouse edging the time-bucket rollup inside its own MergeTree, and DuckDB loaded the ten-million-row corpus several times faster (457 ms against 3.9 s). So the swap is cheap and the answers come out the same.
What this is, and what it isn't.
The boundary matters as much as the result. This is embedded ClickHouse, not a tuned cluster, and a million to ten million rows sits below the scale where MergeTree's ordering and indexing and ClickHouse's distributed scale-out start to pay, and neither engine was hand-tuned. So this does not contradict the lab's other ClickHouse number: the flagship two-regime result against a schema-on-read SIEM (the lakehouse engines 5–62× faster on the hunting-shaped aggregations, 46.8× native / 10.1× Iceberg on the five-query average, the index winning the simple lookups) is a different comparison at a different scale — and it does not lower ClickHouse's score for the dashboard-serving archetype in the matrix, which rests on exactly that large-scale latency, so the two results sit beside each other. As with the flattening benchmark this is Tier B, the corpus is synthetic, and the millisecond figures are medians on one machine; read them as which engine wins which query shape rather than as numbers to expect on your own hardware.
Run it yourself
Same corpus, both engines, your machine
The deterministic corpus generator, the five queries in both dialects, the answer-equality check, and the per-scale timings are public. The harness regenerates the corpus twice and verifies the fingerprint matches, and asserts every query's answer is identical on both engines, before it reports a millisecond.
View the benchmark on GitHub →DuckDB 1.5.3, chDB 4.1.8, fixed seed. The reasoning behind the interchangeability claim is in The cost paradox.
Published benchmark · no. 4
The same Sigma correlation rule compiles to four backends three different ways, and one drops the time window without an error.
Sigma's promise is that a detection written once compiles to whatever backend you run. It holds for simple filters, and correlation is where it strains. This compiles eleven rules — six single-event and five correlation — to four open backends and measures what survives. Every backend emits text, so no commercial software runs and the code is fully public.
| Backend | Single-event | Correlation result |
|---|---|---|
| Splunk SPL | 6/6 | 4 preserved in full, refuses ordered sequences |
| Elasticsearch ES|QL | 6/6 | 4 preserved in full, refuses ordered sequences |
| Elasticsearch Lucene | 6/6 | refuses all 5 (filter-only — a safe, loud failure) |
| OpenSearch PPL | 6/6 | translates all 5, but drops the time window on 3 |
Single-event rules ported to all four backends. Correlation is where they split. Lucene refuses every correlation rule, which is the safe failure: a filter-only language cannot aggregate, so it raises at compile time rather than emit something that means less than the rule. Splunk SPL and ES|QL preserve the count, distinct-count, and unordered-temporal correlations in full (aggregation, threshold, and the time window all present), and both refuse the ordered-sequence type.
OpenSearch PPL is the one to watch. It translates every correlation type, including the ordered sequence the others refuse, but on the brute-force and spray detections it drops the time window: a rule meant to fire on ten failed logons in five minutes compiles to one that counts over the whole search range and fires on ten-ever. The query is valid, it runs, it looks correct, and nothing errors, which is what makes the loss easy to miss. PPL keeps the window on the temporal rules, so the drop is specific to its count path.
What this is, and what it isn't.
This is Tier B and it measures what the pySigma compiler emits, not what a target SIEM executes, since a window absent from the query might be supplied by a dashboard time range, and a present construct is not proof of correct execution. But the query is the artifact a practitioner copies into a SOC, so a dropped window is one someone has to add back. The fidelity checks are disclosed, the verbatim queries are recorded, and a newer backend release can move any cell, so the result is pinned to specific versions and meant to be re-run.
Run it yourself
Eleven rules, four backends, the verbatim queries
The rule set, the four backends with their pipelines, the disclosed fidelity checks, and every generated query are public. The harness compiles each rule twice and asserts the output is byte-identical before it scores anything.
View the benchmark on GitHub →pySigma 1.3.3, pinned backends. The reasoning behind the result is in Sigma 2.0 correlations and the pySigma backend reality.
Published benchmark · no. 5
Okta and CrowdStrike both map into OCSF 1.8.0 with real loss, and Okta's own shipped mapper carries fewer fields than the schema would hold.
The recurring boundaries in the six-schemas crosswalk were derived on paper. This runs two more vendor schemas through a deterministic benchmark that scores every documented field as typed, coerced, or unmapped, with each OCSF target validated against the published schema so a mapping cannot invent a home that is not there. The losses match the boundaries, and the larger gap turns out to be between the schema and the integration, not inside the schema.
| Source → OCSF class | Typed coverage | Where it loses |
|---|---|---|
| Okta System Log → Authentication (3002) | 58% (29/50) | outcome enum collapse, free-form risk maps, proxy-chain flatten, no is-proxy flag |
| CrowdStrike Detection Summary → Detection Finding (2004) | 70% (30/43) | ATT&CK id-vs-name, IOC-type enum, disposition bitmask, grandparent lineage |
Both sources map into the class built for them, and both lose meaningful fields on the way. Okta's System Log lands 58% of its login fields on a typed OCSF attribute and loses the rest to coercion or the unmapped bag: a seven-value outcome enum narrows to three, the risk and threat signals sit in a free-form map OCSF has no typed home for, the forwarding chain flattens to a bare list of IPs, and the anonymizing-proxy flag has no endpoint attribute to land on. CrowdStrike's detections do better at 70%, because hashes and command lines are well modeled, but its ATT&CK tactic and technique arrive as flat strings where OCSF wants an id and a name both, its IOC type has to squeeze into a fixed enum, and its multi-action response bitmask collapses to one disposition.
The second finding is sharper, because it is about what a shipped mapper does rather than what the schema allows: OCSF 1.8.0 has a typed or coercible home for 36 of Okta's 50 login fields, but Okta's own open-source reference mapper carries only 18 of them into the event, leaving the autonomous-system, ISP, network-zone, and credential-type fields unmapped even though the schema would hold them. So the loss is partly what the standard cannot represent and partly what a shipped integration leaves behind, and that second gap is the larger of the two. Of eleven named detections scored against the result, eight lose at least one field they depend on, while three survive clean, including impossible-travel and known-bad-hash, because geo and file hashes map without a fight.
What this is, and what it isn't.
This is Tier B and it scores a documented mapping judgement against real vendor schemas and the real OCSF 1.8.0 schema, not production telemetry. Every OCSF target is validated against a checked-in copy of the schema, so a mapping cannot point at an attribute that does not exist, and the run is deterministic, scoring twice and asserting the two are identical before it writes anything. The Okta inventory is the login event family; the CrowdStrike inventory is the public Detection Summary Event, not the gated full Falcon Data Replicator schema, so the coverage figures are for those field sets, not for everything either vendor emits. The per-field calls are a judgement, published one line each so they can be argued with.
Run it yourself
Two vendor schemas, every field, the mapping rationale
The field inventories with provenance, the OCSF 1.8.0 schema subset, the field-by-field mappings, and the named detections are public. The harness validates every OCSF target against the schema and scores the result twice before it writes a number.
View the benchmark on GitHub →OCSF 1.8.0, Okta and CrowdStrike sources with documented provenance. The reasoning behind the boundaries is in Six schemas into OCSF.
First-pass benchmark · no. 6
Coarsening multi-source telemetry into one OCSF store leaves the routine queries untouched and quietly breaks the ones that catch an intruder.
The flattening benchmark above takes one source and one failure mode. This one takes four — endpoint, network, identity, and cloud — builds a six-stage intrusion through all of them, then asks the same sixteen questions of two stores built from the same corpus: a fidelity-preserving store and a single coarse store of the kind a real pipeline produces under cost pressure. The routine SOC queries come back identical from both. The detection-and-response queries do not.
| Loss mechanism | Δ degradation | What the coarse store dropped |
|---|---|---|
| grain | +1.00 | atomic detail: the 60-second beacon cadence, the exact encoded payload, the rare first-seen domain |
| structural | +0.99 | an absent MFA flag coerced to false, so “no MFA” can’t be told from “MFA was false” |
| bounded-context | +0.55 | identity and asset flattening: one human’s SID, principal, and role no longer link |
| time | +0.52 | one timestamp from ingestion: a buffered event lands in the wrong window, point-in-time is gone |
The headline is +0.72 on a scale where zero would mean coarsening hurt the adversary queries no more than the routine ones. It clears that bar because the routine control sits at exactly zero: the coarse store counts authentications, ranks destination ports, and rolls up egress bytes precisely as the fidelity store does, which is the point, because it isn’t a crippled strawman, it’s the store that serves the dashboards perfectly and then can’t reconstruct the breach. What it loses is specific. The 60-second beacon dissolves into 5-minute flow rollups. The base64 PowerShell payload is truncated away. The privilege escalation with no MFA looks identical to the 267 routine policy attaches because absence was written as false. The one human wearing an endpoint SID, an IAM principal, and an assumed role can no longer be closed into a single actor.
And not everything breaks, which is the honest shape of the result rather than a clean sweep: the kill-chain ordering and the dwell-time calculation mostly survive coarsening, because their evidence still reads through a five-minute rollup. The queries that crater are the ones whose evidence the coarse store physically threw away, and a benchmark that claimed every adversary query broke would be less believable, not more.
What this is, and what it isn't.
This is Tier B, and a first pass. The corpus is synthetic and the headline intrusion is one APT29-style chain on a single machine, so the magnitudes are specific to this testbed, not production rates. The coarse store’s every choice, from indexing on receipt time to rolling network into flows, flattening identity, truncating command lines, coercing missing booleans, and sampling rare DNS, is a documented real-world default written up alongside the code, and the routine control is the evidence it isn’t a strawman. The piece I can’t supply myself is the gate that would move this past a first pass: an independent practitioner confirming the coarse store resembles what shops actually build.
The one thing I did push on, because it’s the obvious objection to a synthetic result, is whether the gap is a property of coarse normalization or just an artifact of this one attack. So I ran a second, independent chain through the same frozen battery, a different actor on a different subnet with a different C2 domain and IP, a different encoded payload, and an SMB lateral move where the first chain used RDP, with the questions reading their indicators from ground truth rather than hardcoding them and the same background noise underneath so the chain itself was the only thing that changed. It landed at +0.71 against the first chain’s +0.72, with the same per-mechanism shape and the routine control still clean. The magnitudes are still specific to this testbed, but the mechanism reproduces across two unrelated attacks, which is the part I had half-expected to be fragile and wasn’t.
Run it yourself
Two stores, one corpus, sixteen frozen questions
The corpus generator with its planted-chain ground truth, both store builds, the sixteen-query battery, and the scoring all run deterministically from one seed. The result is scored twice and asserted identical before it writes a number, and the query set was frozen before either store was built.
View the benchmark on GitHub →The information-loss theme starts in Flattening away your detection logic.
First-pass benchmark · no. 7
On a small local model, the schema and an ontology-thinking discipline cut the OCSF attributes it invents — but a conceptual grounding note does no more than a deliberately wrong one.
The same source-to-OCSF mapping task over 141 gold mappings across six vendor sources, under five conditions: nothing but the field name; the OCSF schema in context; the schema plus a conceptual grounding note; the schema plus an ontology-thinking discipline (decide actor versus object first, take the most specific path, never invent an attribute); and — as a control — the schema plus a grounding note for the wrong OCSF class. The metric that matters is the silent-error rate: how often the model maps a field to an OCSF path that does not exist in 1.8.0, the failure that validates and ships as a real mapping and is wrong.
| Condition | Silent-error rate (invented paths) |
|---|---|
| parametric only | 0.99 |
| + schema in context | 0.69 |
| + conceptual grounding | 0.72 |
| + ontology-thinking discipline | 0.60 |
| + wrong grounding (control) | 0.72 |
Putting the schema in front of the model is what moves the needle — invented paths drop from 0.99 to 0.69 — and the ontology-thinking discipline cuts them furthest, to 0.60. The control is the honest surprise: the conceptual grounding note lands at 0.72, exactly where a wrong-class grounding note lands, and neither beats schema-alone. So the grounding note’s content did no work here; it was extra tokens, and the reasoning discipline, not the grounding, is the lever. Exact path-correctness stays near zero throughout, because a 3.8-billion-parameter local model rarely lands the precisely-right path even with the schema in hand, which is why silent-error rate is the headline. That the formal grounding pays nothing over plain schema-conformance for field mapping is the same result the deductive grounding work found, now seen on a different task. Whether the discipline’s lift is a sub-frontier teaching effect or holds at the frontier is the next question — it needs the frontier leg this first pass doesn’t yet run.
Run it yourself
Five conditions, one gold key, every path validated.
The gold mappings are the hand-curated vendor-to-OCSF answer key from the field-mapping benchmark (141 mappings, six sources), and every predicted path is checked against the OCSF 1.8.0 schema so an invented attribute is caught rather than counted. This is Tier B and the local-model leg only; an independent frontier model is the expansion.
View the benchmark on GitHub →The mapping boundaries it builds on are in The field-mapping anti-pattern.
First-pass benchmark · no. 8
A local model writing SQL to hunt an intruder fails loudly, not silently — the opposite of the frontier failure mode this benchmark is built to catch.
The plan is a three-way: a formal virtual rewrite (OBDA / Ontop) against two LLM-mediated runtimes (GraphRAG and plain text-to-SQL), asked the same adversary-tail concept questions over the fidelity store, with the decisive metric being the silent-error rate — a query that runs and returns a plausible-but-wrong answer. Two of the three arms are now built — the text-to-SQL baseline and the OBDA formal rewrite (Ontop over the store); the GraphRAG arm is still pending the tooling and labelled as such, so the comparison is honestly partial rather than implied.
On a 14-billion-parameter local model, the text-to-SQL baseline answers two of four adversary queries correctly — the single-table filters (the exact encoded payload, the privilege escalation with no MFA) — and fails the two that need more (the beaconing-cadence detection and the first-seen domain), where it writes SQL that errors or returns nothing. Result accuracy is 0.50 and the silent-error rate is zero: the failures are loud. That is the honest and slightly surprising first-pass observation, because the confidently-wrong tax that NL2KQL measured at ~42% in security telemetry is a frontier-model phenomenon, and a sub-frontier local model doesn’t reach it — it breaks visibly instead. Whether a formal rewrite avoids the silent errors a frontier LLM does make is the actual head-to-head, and it needs the frontier leg this first pass doesn’t yet run.
The OBDA arm is the formal counterpoint: Ontop exposes the store as a virtual RDF graph and rewrites SPARQL to SQL over an OWL2QL ontology. On the three adversary-tail queries OWL2QL can express, it is exact — three of three correct, zero silent errors. The five it can’t express (cadence, cross-source ordering, recursive identity closure, dwell, distinct-count — all aggregation or recursion, outside first-order rewriting) it refuses rather than guessing. That is the shape the head-to-head is built to surface: the formal rewrite answers fewer queries but is never silently wrong on the ones it answers, and its failures are a loud out-of-expressivity boundary, where a frontier LLM’s failures on this tail are silent. Which kind of failure you can live with is the real decision; the pending GraphRAG arm and a frontier text-to-SQL leg would complete it.
Run it yourself
Two arms, scored against planted ground truth.
The text-to-SQL and OBDA arms run over the same planted-chain testbed as the context-collapse benchmark, scoring each answer correct, silent, or loud against the known ground truth. The GraphRAG arm is scaffolded with its blocker recorded, not faked. Tier B, two of three arms.
View the benchmark on GitHub →First-pass benchmark · no. 9
Under a stream of small commits, the file-write contract writes four files for every one the transaction contract does — and pays it back in latency.
How does data actually enter the store? File-write (classic Iceberg writes a new data file, a manifest, and a fresh metadata.json on every commit) versus SQL-transaction (DuckLake commits an ACID transaction against a catalog that can inline small batches). The decisive case is small-batch streaming, where the per-commit overhead is paid most often. Both arms ingest the identical seeded OCSF stream, and one engine then reads both tiers to check the unified read contract actually holds.
| Ingest pattern | Iceberg (file-write) | DuckLake (SQL-txn) |
|---|---|---|
| small batches (100 rows × 50) | ~31 ms p50 · 4 files/commit | ~15 ms p50 · 1 file/commit |
| large batches (5000 rows × 10) | ~23 ms p50 | ~17 ms p50 |
On the small-commit rung the file-write contract pays a per-commit metadata-and-manifest tax — roughly four files and about twice the commit latency of the transaction contract, and several times the storage. On large batches the gap narrows, because that per-commit overhead is paid once over many rows, which is the honest shape: the write contract matters for streaming, not for bulk load. The systems result underneath is the read-contract check — one engine reads both tiers and returns identical answers for the same logical data, so the unified-read-contract premise holds here for these two backends, once you write a version hint that DuckDB’s Iceberg reader needs and the writer doesn’t emit (a small, real interop wrinkle worth knowing about).
Run it yourself
Two write contracts, one seeded stream, the read contract checked.
Both arms ingest the same reproducible OCSF batches; commit latencies are this host’s medians, not constants. The third contract — never-write (Streambased ISK, where producing to Kafka is the write) — has no independent deployment to measure and is recorded as pending rather than estimated. Tier B, two of three arms.
View the benchmark on GitHub →Arrow transport: ADBC vs JDBC
Pulling an OCSF result set out of the store over ADBC (Arrow, columnar) versus JDBC (row-oriented): ADBC is roughly **5–10× faster** than a native-JVM JDBC client on the same DuckDB query, scaling with result size. (An earlier pass reported ~276× by timing JDBC through a Python/JPype bridge; a native Java JDBC baseline shows that was ~40–50× bridge overhead, not transport — the columnar-vs-row advantage is the single digits.) An edge-case type battery (HUGEINT, decimal, microsecond timestamp, null, array, map) came back clean on both transports. Code →
Iceberg metadata & compaction — the small-files tax
As an Iceberg table accumulates small streaming appends, scan-planning cost grows with the file/manifest count (planning reads every manifest before touching data), and compaction recovers it. The magnitudes here are illustrative of that mechanism, not production figures — measured by pyiceberg's own planner on deliberately small files — and this is a within-Iceberg fragmentation cost, not a format comparison. Code →
DuckLake vs Iceberg, large-scan reads
The read-side companion to the write-contract benchmark: 10 million rows materialized in both formats and read by the same engine. They return identical answers and land within ~2× of each other depending on the query shape — interchangeable on read, so the format choice rides on the write pattern, not the scan. Code →
Sigma rules, executed over the OCSF store
The execution complement to the Sigma-portability benchmark: real Sigma rules compiled to SQL and run against the planted-chain store detect all four chain stages. The precision split is the honest half — specific rules (encoded PowerShell, no-MFA escalation, a known C2 domain) fire cleanly, while a naive "any RDP connection" rule catches the lateral-movement needle but drowns in thousands of benign port-3389 connections. Multi-event correlation rules go further: a temporal-ordered exec→lateral sequence is detected (linking the process and network sources via a host key the fidelity store preserved), but it compiles on only one of four backends, and the event-count rule's time window is silently dropped by the SQL backend — correlation portability is where the standard frays. Code →
DuckLake inlining vs Iceberg — small files at the source
A hundred small streaming commits leave 100 data files under classic Iceberg (plus a manifest and metadata file each), 100 under DuckLake with inlining off, and zero under DuckLake with inlining on — the rows live in the catalog until a flush threshold, so the tiny files are never created rather than created and compacted later. The data stays queryable throughout. Code →
Storage endurance — is write-intensive NVMe over-specified?
Measured write amplification on OCSF data is ~0.43 — compression outweighs the compaction rewrite, so fewer bytes hit disk than the raw log volume — which projects to well under 1 drive-write-per-day across realistic security ingest rates, far below the read-intensive (~1 DWPD) and write-intensive (~10 DWPD) tiers. The write-amp is measured; the DWPD is a transparent projection you can re-run with your numbers. Code →
Harness vs model — a schema-constrained OCSF mapper
A deterministic mapper that only ever emits paths that exist in OCSF 1.8.0 has a silent-error rate of zero by construction — versus the local model's 0.60–0.99 from the mapping-oracle benchmark — and even edges it on overall path-correctness, at a coverage cost (it marks unfamiliar fields unmapped rather than guessing). The lesson isn't "rules beat models"; it's that the schema constraint in the harness does the safety work, and a model is only safe behind the same constraint. Putting the model behind that same constraint confirms it: constrained, the model is safe (silent-error zero) but still ~8× worse than the alias rules on correctness, so at this capability tier the harness, not the model, carries the result. Code →
Notebook format — a marimo hunt, reproducible and portable
An OCSF hunt written as a marimo notebook is a plain .py that re-runs identically headless (it finds the planted needles every time) and carries none of the execution-count and embedded-output state a Jupyter .ipynb accretes, and the hunt is portable SQL with no notebook-runtime lock-in. For detection content that has to be reviewed, versioned, and run anywhere, the authoring format is the lock-in frontier. Code →
Do Parquet readers verify page checksums?
A one-byte flip inside a checksummed Parquet page is a three-way split across readers: chDB verifies the CRC by default and errors, pyarrow and Polars ship the verifier but leave it off, and DuckDB and DataFusion have no read-side check at all, so four of five hand back a confident wrong sum (with no checksum, all five do). It's the same silent-wrong-answer failure mode as the engine bugs, one layer deeper, and the integrity backstop is one keyword argument away yet off in the path almost everyone uses. Code →
Parquet encoding × library decode correctness
Six readers across the encoding grid (PLAIN, RLE_DICTIONARY, the DELTA family, BYTE_STREAM_SPLIT) checked against exact ground truth. On these versions there are no silently-wrong cells: the exotic encodings fail safe (fastparquet and DuckDB error on the ones they don't support) rather than mis-decode, and at default settings every writer's output round-trips through every reader, including DuckDB's deprecated PLAIN_DICTIONARY. The empirical companion to the Apache implementation-status matrix, checking that claimed support and a correct answer are the same thing. Code →
Does pruning ever drop the needle?
Row-group statistics, the page index, and bloom filters let an engine skip data it believes can't match, which is sound only if it never skips a block that does. A sorted-versus-shuffled A/B over an identical million-key file (only the row order differs, so any disagreement isolates a pruning bug) plus a bloom-filtered file, across five engines, finds every engine sound. The chDB equality-pushdown undercount does not generalize into unsafe pruning, so this stands as the regression guard for the pushdown paths rather than a new defect. Code →
Compute determinism and Parquet encryption portability
SIMD dispatch (Arrow forced scalar, SSE4.2, AVX2) is byte-identical, so vector width is not a determinism risk; but the same float column summed by five engines lands on three last-ULP-different totals while the integer sum, count, min, and max are bit-identical, so exact-typed answers are safe to compare and to hash for chain-of-custody and float-derived ones need a stated tolerance. And a Parquet-Modular-Encryption file is readable only by the library that wrote it holding the key, so at-rest encryption inside the file revokes the open read contract unless you keep it at the volume layer. Code →
NULL, type-coercion, and timezone semantics across engines
The shapes detections actually use, over byte-identical data against a SQL-standard answer. The everyday NULL traps are portable — <>, NOT IN, and IN all silently drop NULL rows on every engine — but two diverge: NOT IN (a, b, NULL) is empty by SQL three-valued logic on DuckDB and DataFusion, a silent allowlist bypass, while chDB returns the rows, and a time-window count under a non-UTC session disagrees three ways. The same rule gives different answers per engine, the answer-equivalence risk pushed into query semantics. Code →
Where it breaks
Architectures fail at an edge, not at a row count.
The benchmarks above ask which architecture wins at a fixed point, but the question that decides a migration is inverted: where does the architecture you're running break, how much warning do you get, and what's the reversible next move. Re-reading the whole catalog that way produces a map — three architecture regions, the measured edges between them, and the failure shape at each edge, which matters because a graceful edge announces itself in the latency tail quarters ahead while a cliff gives no warning at all.
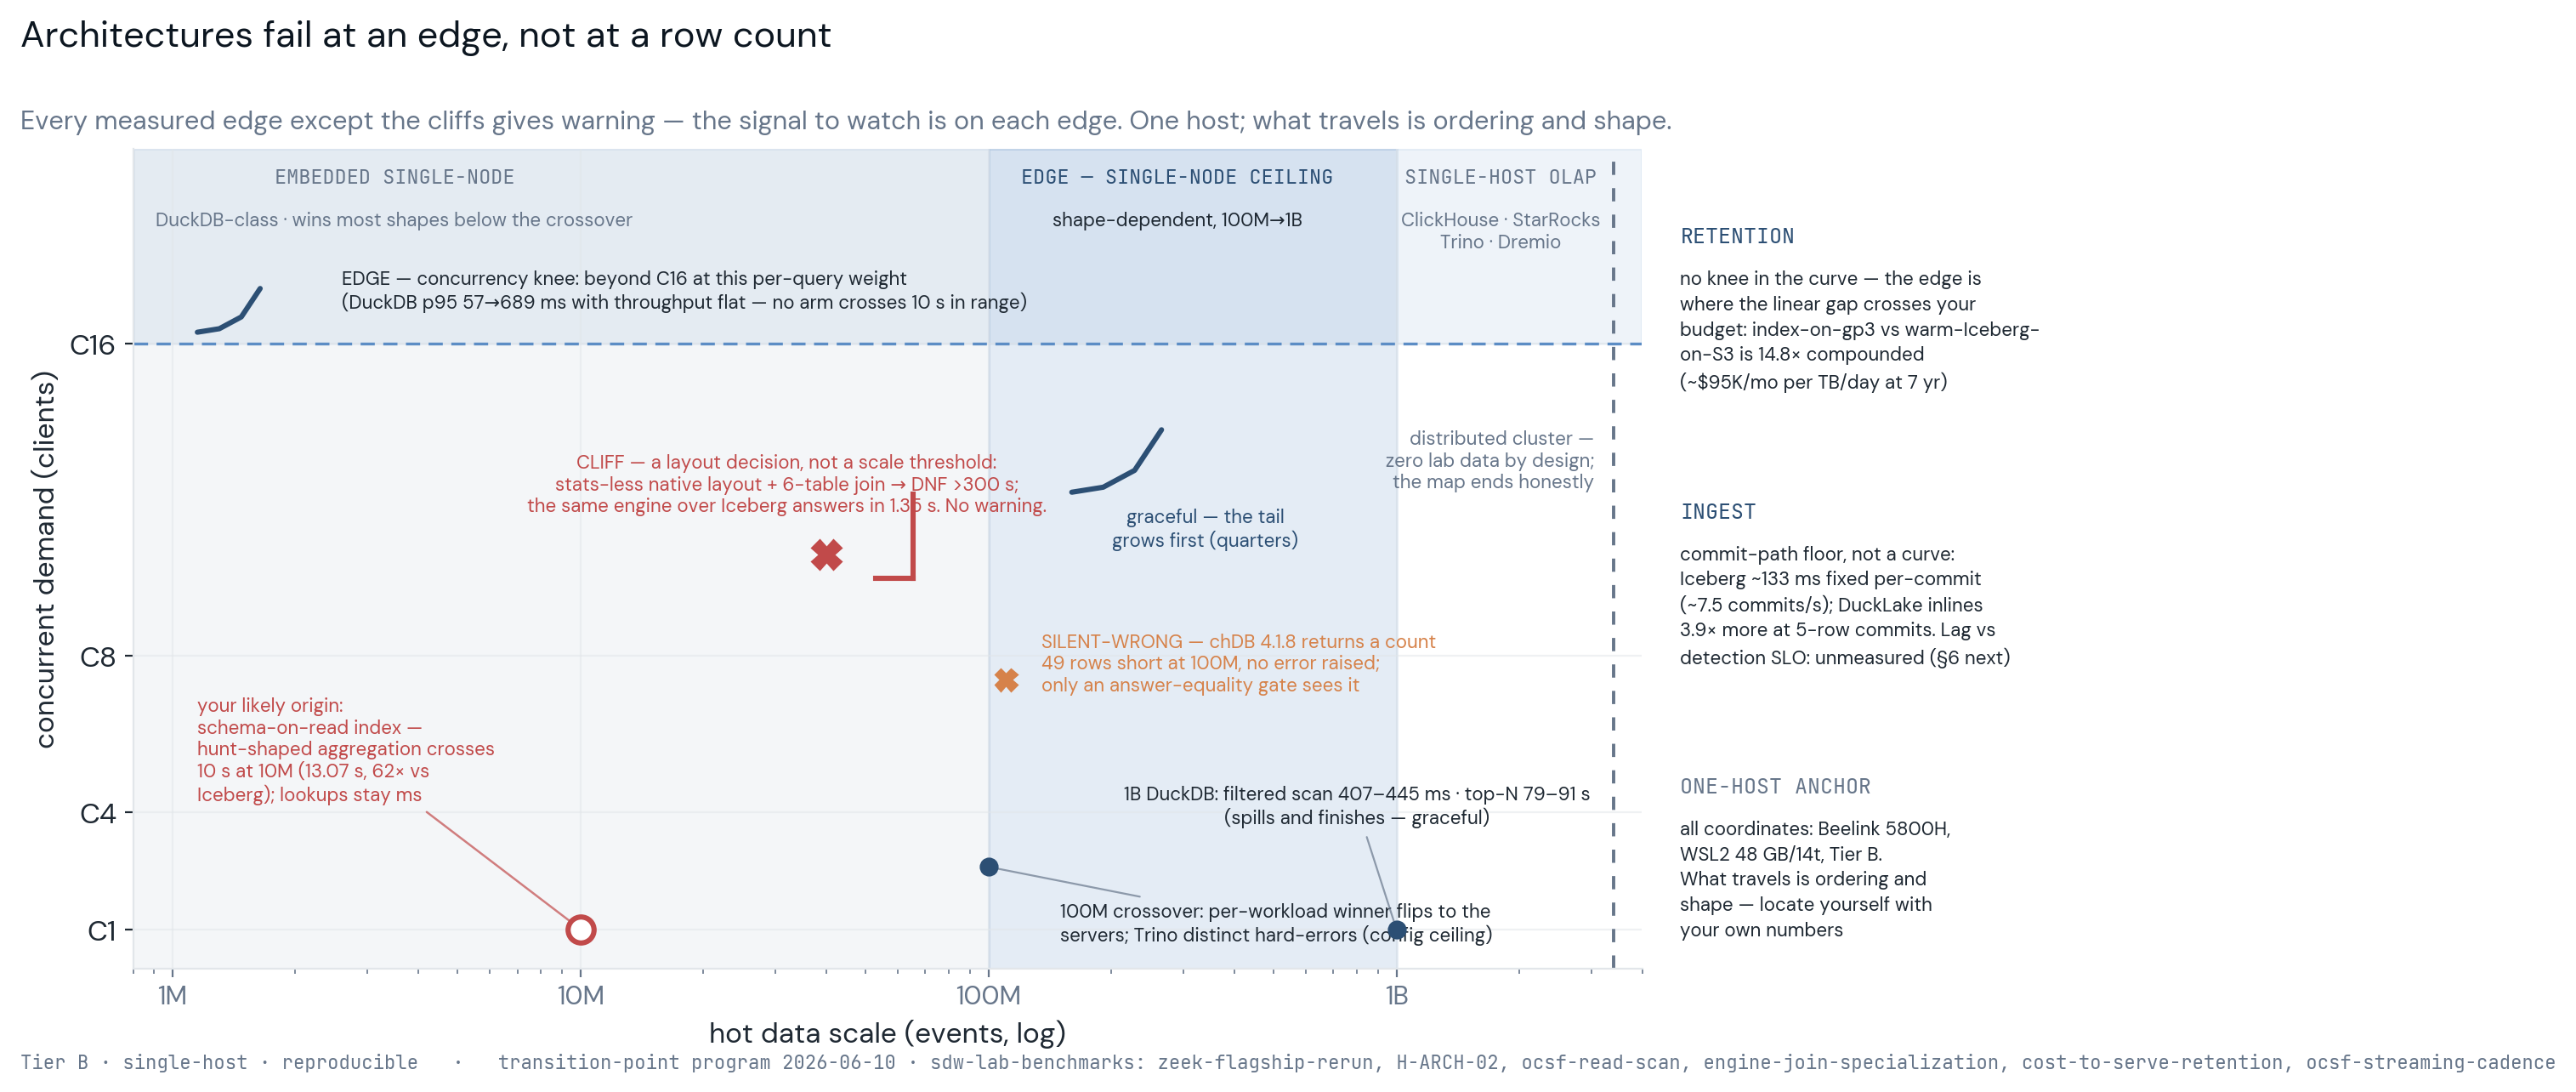
Every edge on the map except the cliffs gives warning, and each one has a signal you can watch for in your own environment, which is the honest way to use one-host coordinates: what travels is the ordering and the failure shape, not my absolute numbers. Seven questions you can answer from your own telemetry this week, one per dimension:
- Scale — did your slowest routine query's p95 grow faster than your hot table's row count over the last two quarters?
- Mix — is scheduled-cycle utilization (total scheduled-search runtime per cycle divided by cycle length) above roughly 0.7 and rising?
- Concurrency — is busy-hour p95 more than about 3× off-hours p95, and growing with headcount?
- Joins — does any correlation search die while its single-table components return in seconds? This is the one edge that gives no curve: it's a cliff, and the fix is a layout decision rather than a scale threshold.
- Retention — what fraction of your data older than 90 days was actually queried last quarter, and at what hot-tier $/GB against an S3-class price?
- Ingest — does source-to-queryable lag ever exceed your fastest scheduled detection's interval?
- Sources — how many production sources have no owned, tested parser? The map draws this edge dashed, because it's practitioner evidence rather than a lab measurement.
I'd rather you measure these than take my coordinates. The public stack ships a runnable data-health gate (./moar healthcheck), and the public suites behind this map publish their methodology so you can point them at your own environment (the one NDA-held benchmark above is the exception, for the licensing reasons it documents). If measuring is itself the missing capacity, that is what the Data Health Validation engagement exists for — the done-for-you version of the same questions.
Model it for your workload
Storage compression ROI calculator
The 8.5× Iceberg Parquet compression result against raw JSONL on the pinned 10M-event Zeek corpus is the benchmark observation (ClickHouse's blanket-ZSTD-22 store lands 9.0× on the same corpus). Plug in your own daily ingest volume, current per-GB-month storage cost, and retention to see how the result scales. Storage cost only; licensing and compute aren't modeled here.
Pre-compression. Volume that hits storage today.
S3 Standard ≈ $0.023. Splunk indexed ≈ $3–10.
Typical SOC: 12–24. Regulated: 84 (7 yr).
Current
—
monthly storage at steady state
With 8.5×
—
monthly after compression
Annual savings
—
3-yr: —
The 8.5× ratio is Iceberg Parquet against raw JSONL on Zeek-shaped network telemetry. Other log shapes vary: endpoint telemetry and identity events typically compress less, cloud control-plane events typically compress more. The number is directional for your workload, not precise. The bigger gap on Splunk-licensed deployments is per-GB-ingested licensing rather than storage; this calculator doesn't model that.
Compare architectures
The storage line, side by side
The same inputs, run against the two architectures this site examines: indexed-SIEM storage at its list-price rate, and a lakehouse on object storage with the measured columnar compression applied.This models the storage line only; it is not a TCO model. Ingest licensing (usually the bigger line on a SIEM bill), compute, egress, and people aren't in it, so read the output as a single line item on a much larger bill.
Indexed list price runs $3–10 (Tier C).
S3 Standard ≈ $0.023.
Indexed SIEM
—
monthly; raw bytes at the list storage rate (Tier C basis)
Lakehouse on S3
—
monthly; 8.5× columnar compression, then object rates (Tier B measured)
Multiple
—
computed from your inputs; combines the rate gap and compression, storage line only
For calibration against the published figures: the widget combines two effects at once, the list-price rate gap and the 8.5× compression, so at the default inputs its output runs well above either published anchor, and that is the honest reading of what list-price economics look like before any discounting. The conservative brackets this site actually carries are the 130–227× list-price multiple on the raw storage line (Tier C, carried conservatively, with compression deliberately excluded) and the lab's measured floor of 14.8–96.7× (Tier B, counting both the fewer bytes an open format writes and its cheaper price per byte), which works out lower than any list-rate comparison because it uses measured SIEM-side economics rather than list rates. The 8.5× compression is the flat-Zeek result and is corpus-dependent (endpoint and identity telemetry typically compress less, cloud control-plane events more), so treat the lakehouse arm as directional.
How the lab runs benchmarks
Five principles. Documented before any tool runs.
Reproducibility before performance.
A benchmark result that can't be re-run isn't a benchmark; it's an opinion. Every published result ships with the methodology document, the containerized environment definition, the data generators, the query suite, and the analyzed output. A practitioner with the same hardware and same data can re-run the experiment and verify the number independently. The reference implementation is shared under NDA with engagement prospects and qualifying reviewers — not published openly, because the comparison set includes commercial software whose licensing terms restrict third-party publication of comparative benchmark results. The methodology, the result, and the reasoning are public; the executable artifact is gated by a one-page NDA.
Identical workload across candidates.
Workload and queries are defined and pinned before any tool is run. No per-tool tuning advantage; the same query suite runs against the same data on every candidate engine. Vendor-recommended configurations are tested as additional rows in the result table — labeled clearly as vendor-recommended — rather than folded silently into the headline. The point is to characterize each tool's behavior on the workload, not to engineer the most flattering possible result for any one of them.
Documented caveats.
Every result ships with what was tested, what wasn't, and which workloads the result generalizes to. The benchmark is single-node; production environments typically run multi-node, and multi-node behavior is still outside what this suite captures. Single-node joins, though, are no longer an open question. At single-node SOC scale the spread between compliant engines is compressed: every engine answered the SOC join suite in under 1.5 s (Tier B, single host). I don't name a winner at this scale, and TB-scale vendor claims are a different regime this bench neither confirms nor refutes — engine choice mostly turns on catalog maturity, concurrency behavior, and operational cost. The benchmark covers analytical aggregation queries; full-text-search-dominated workloads aren't in the query suite, and the result generalizes less cleanly to those. The benchmark uses one log type (Zeek conn.log); other log shapes (endpoint telemetry, cloud control plane, identity events) carry their own performance characteristics. The caveats are the part that lets a reader know whether the number applies to their environment.
Vendor cooperation invited, not required.
Every vendor whose product appears in a benchmark is invited to review the methodology and propose configuration changes before publication. Vendor-proposed configurations are tested and reported as additional result rows, labeled clearly. The lab doesn't accept funded benchmarks, doesn't allow pre-publication vetoes, and doesn't allow vendors to dictate workload selection — but the methodology review is open, and that openness is part of why the published numbers survive contact with the vendors after release.
External review on annual cadence.
Once a year, an outside practitioner with the relevant standing — security data engineer, OCSF contributor, or analyst with quantitative-benchmark expertise — audits the lab's published results under NDA. They get the same access an engagement prospect gets: full methodology, full reference implementation, the underlying analysis JSON. Their signoff drives corrections to the public results. The first annual external review is scheduled for Q4 2026; the reviewer will be named here, with any flagged issues, when that review completes. Until then this is a forward commitment, not a claim of a signoff that already exists.
What we changed our mind on
The benchmark headline doesn't carry the cost story alone.
For most of 2025, the operational reading of the benchmark was straightforward: ClickHouse is 145× faster and meaningfully cheaper than the schema-on-read SIEM on equivalent workloads. Both halves of that statement need revising. On speed, the CV-gated re-run replaced the single-query 145× with the two-regime finding: the index wins the simple lookups, and the lakehouse engines win the hunting-shaped aggregations by 5–62×, a 46.8× native / 10.1× Iceberg five-query average — the advantage is real but query-shaped, not one flat number. On cost, the framing is more complicated than the early write-ups admitted, and the page where it gets revised is the lab page itself, not a footnote elsewhere.
ClickHouse is cheap versus per-GB-ingested licensing models. 30–90% cost reduction is documented across multiple production deployments — Huntress, Uptycs, Hunters, Panther — and reproduces in TCO modeling. ClickHouse is comparable to Snowflake or Databricks SQL at sustained TB/day workloads, where the managed pricing converges. ClickHouse is structurally more expensive than Iceberg-on-S3 with a separate query engine, because the MergeTree format duplicates data already storable in open formats on S3, the compute and storage scale together rather than independently, and the replication overhead multiplies storage cost. This is the finding the Capability Matrix accounts for directly, which is why it lowers ClickHouse on the cost-led and federated archetypes rather than on the latency-dominated one, so the high latency ranking under Archetype A and this cost admission are scoring the same engine against different criteria, and they agree rather than conflict.
The updated framing the lab uses today: the benchmark validates the performance claim cleanly. The cost claim only carries when the comparison baseline is named — versus the legacy schema-on-read licensing model specifically, not in the abstract. Production deployments that lean ClickHouse-first on hot tier and Iceberg-on-S3 on cold tier are an emerging pattern that captures both the latency advantage and the open-format cost economics. The lab's planned Q4 work on streaming write maturity into Iceberg is partly aimed at characterizing this hybrid shape. It's also why the Capability Matrix ranks ClickHouse first only under the latency-bound Archetype A — the Zeek-heavy SOC, where query speed is weighted 22 and storage cost is not a scored criterion — and reorders toward Iceberg-native engines under the cost-led and federated archetypes; the matrix and this benchmark agree that ClickHouse wins where latency is the design center, not where cost is. The 2026-06 engine-join bench pushes the same direction from the join side: at SOC single-node scale (Tier B, single host, 10M–60M-row tables) every engine answered the SOC join suite in under 1.5 seconds, and the 53.0M-pair large-large correlation join landed in a statistical three-way tie at roughly 0.86s across StarRocks and both ClickHouse arms, so what security teams need from an engine at that scale is manageability, and the choice should ride on catalog maturity, concurrency behavior, and operational cost rather than on the join-latency war.
Cadence and access
Quarterly. Public methodology, paid synthesis.
One tool-eval report per quarter. The topic is announced one quarter ahead so vendors can review the methodology and prospective clients can request scope adjustments before the workload is pinned. The benchmark itself ships in the quarter it's announced for: Q3 catalog comparison runs across July, August, and September with the report landing late September.
The benchmark methodology, code, and headline numbers are published openly to GitHub. The synthesized report — the recommendation per environment archetype, the workload-shape sensitivity analysis, the TCO modeling layered on top of the raw numbers — is included in paid engagements above $25K. The split is intentional: the benchmark is a public good; the synthesis is the engagement deliverable.
The lab also accepts ad-hoc benchmark proposals from prospective clients during engagement scoping. If the workload archetype on the table doesn't have a published benchmark answering the central question, the engagement can include a workload-specific run. The methodology rigor is the same as the published benchmarks; the result publishes on the lab page after the engagement concludes.
Turn a published benchmark into a decision for your workload.
The matrix scores these engines against your environment's constraints — and every benchmark here is public and reproducible on your own workload, no engagement required.