
The Capability Matrix
A scoring matrix for security data tools.
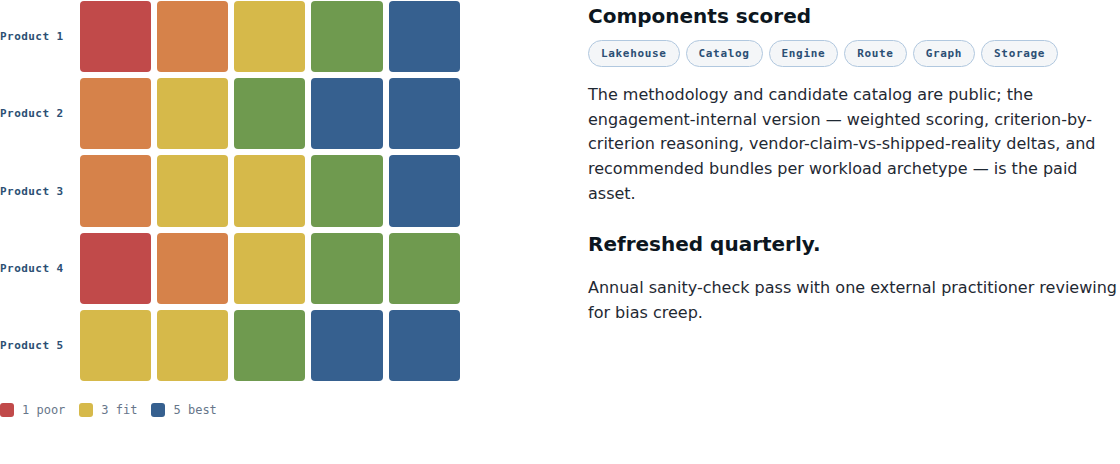
Moving off Splunk means choosing a storage format, a query engine, a catalog, and several more parts, and every vendor claims to be the best at all of them, so the Matrix scores the real candidates against your actual workload instead of their pitch.
Candidate tools scored per component, weighted by your workload. Public methodology and catalog below. The scored version, with reasoning, the vendor-claim-vs-shipped-reality deltas (what a vendor sells against what the product actually does once you run it), and recommended bundles, is delivered inside an engagement.
Read the v1 scoring writeup → — per-archetype orderings, five validation patterns, refresh triggers. 2026-05-25.
Evidence and audit state
Most cells currently sit at evidence Tier B–C. Five first-party benchmarks are now published, four of them with public code you can rerun, and the headline is the ClickHouse 46.8× Zeek run: on a 10M-event Zeek workload, ClickHouse runs the hunting-shaped aggregations 21–62× faster than a schema-on-read SIEM (46.8× on the five-query average; the index actually wins the simple lookups) — answer-equality verified, single-node Tier B. The OLAP join leg has its first scored pass as of 2026-06 (Tier B, single host, 10M–60M-row tables): StarRocks measurably leads multi-table joins and ClickHouse the aggregation shapes, but every engine answered the SOC join suite in under 1.5 seconds, so at that scale engine choice rides on catalog maturity, concurrency behavior, and operational cost more than on join latency. The Tier-A upgrades are still the named Q3 2026–Q1 2027 bake-offs (catalog RBAC, multi-node OLAP federated-join, pipeline OCSF-lossiness), not claims already in hand. The lab's first external review is a Q4 2026 forward commitment; the reviewer is named on the lab page when it completes, not before.
Components
- 0
Platform Pattern — assemble the parts yourself or buy them bundled
Composed vs. Managed (Databricks, AWS Security Lake, Snowflake)
- 1
Lakehouse / Storage Format — the file format your data sits in on disk
Iceberg · Delta Lake · Hudi
- 2
Catalog / Metadata — the index that tracks what data exists and who can read it
Hive Metastore · Polaris · Nessie · Unity · Glue
- 3
Query Engine — what runs your searches and hunts
ClickHouse · Uncle Rico · StarRocks · Trino · DuckDB
- 4
Ingestion / Route — what collects the logs and moves them where they need to go
Tenzir · Vector · Cribl · Kafka Connect · native shippers
- 5
Graph / Visualization / Analyst UX — where an analyst actually looks at the data
Splunk SH federated · Grafana · Superset · custom · vendor SOC UIs
- 6
Storage Tier — where the bytes live and what each tier costs to keep
S3 (Standard / IA / Glacier) · MinIO · Wasabi · NetApp · Dell ECS
These seven components are the MOAR reference architecture. The matrix is the scoring view of the same vocabulary, not a second vocabulary. The architecture narrative, component by component, is on the MOAR thesis page. Component 0 (Platform Pattern) is the composed-vs-managed decision that frames the other six.
Methodology
- Each component is scored against weighted criteria specific to your environment.
- Scores: 1–5 (5 = best fit).
- Weights sum to 100, assigned per engagement based on workload.
- Final scores are weight-adjusted; ties broken by documented qualitative reasoning.
- Cross-component dependencies are explicit (catalog choice constrains query engine, etc.).
Evidence → Matrix → recommendation
The Matrix is the destination every lab benchmark rolls up into. The lab does not publish numbers for their own sake; each reproducible result becomes a 1–5 score on a component criterion, the scores are weighted by your workload archetype, and the weight-adjusted totals produce a defensible recommended bundle. The benchmarks are the evidence; the Matrix is the decision the evidence supports.
How the Matrix works · evidence → recommendation
A cell-winner is not a procurement-defensible default; the recommendation is the weighted total for your archetype, not the best score on any single criterion. The worked example below shows the whole path on one component, and shows the winner change when the archetype changes.
A worked scorecard (illustrative)
One worked example of the method, end to end, on a single component, the Query Engine, for a Zeek-heavy SOC archetype (high-volume network time-series, long retention, sub-5 s p99 on hunting aggregations, a handful of concurrent analysts). The capability scores are grounded in the public lab (Tier B, single host) where the criterion is measured, and qualitative where it is client-specific. It is illustrative: the weights are an example archetype profile, not a client's, and the per-cell vendor-claim-vs-shipped-reality delta (the highest-value paid content) is not shown here.
| Criterion | Wt | CH/Ice | StarRk | Trino |
|---|---|---|---|---|
| Analytical perf (hunting aggregations) | 20 | 5 | 4 | 4 |
| Cost-to-serve (compute $/effective-TB) | 18 | 5 | 4 | 3 |
| Concurrency / multi-tenant | 15 | 4 | 5 | 3 |
| Iceberg native vs connector | 12 | 3 | 4 | 5 |
| Operational simplicity | 12 | 4 | 3 | 3 |
| Routability (deterministic front end) | 8 | 4 | 4 | 4 |
| Semantic-layer / MV rewrite | 5 | 3 | 4 | 2 |
| Federation breadth | 4 | 3 | 2 | 5 |
| SPL→SQL dialect distance | 3 | 3 | 4 | 4 |
| Existing in-house skill base (client-specific) | 3 | 4 | 3 | 3 |
| Weight-adjusted total (max 500) | 100 | 414 | 392 | 358 |
For this archetype the recommendation is ClickHouse-over-Iceberg (414), with StarRocks a close alternative (392). The gap is carried by the criteria where the lab actually separates the engines (analytical aggregation performance and compute cost) more than by any single headline. StarRocks wins the concurrency criterion outright (5 vs 4), which is the whole point of the next paragraph. The per-cell delta between each vendor's published claim and its shipped reality is the paid content; it rides every row above and is where an engagement earns its keep.
The winner changes with the archetype, the same cells under different weights, a mixing board rather than a leaderboard. Re-weight for a many-concurrent-analyst estate (concurrency 32, cost 15, perf 10, ops 11, routability 8, Iceberg-native 10, semantic 4, federation 4, dialect 3, skill 3) and the same cells re-total StarRocks 410 > ClickHouse 404: the ranking flips because the concurrency bench found StarRocks degrades most gracefully under load while the single-query latency edge that wins the Zeek-hunting archetype erodes to a throughput tie at the host CPU ceiling. No cell changed; the workload did. That is why the engagement scores against your archetype rather than publishing a single "best engine."
Honesty boundary: every score here is illustrative and single-host Tier B. At single-node SOC scale the engine spread is genuinely compressed (the join bench put the SOC suite under 1.5 s on all four), so the separation leans on the operational criteria (concurrency, cost-to-serve, Iceberg-native maturity), and the TB-scale / multi-node regime that would re-open the spreads is unmeasured and stays an explicit gap.
Augment vs replace — the decision path
The component scores answer which open stack to pick if you move; the decision path answers whether to move, and how far — the question a board votes on. The incumbent and the partial moves are scored candidate paths, not a foil: Stay (status-quo SIEM), Augment (keep the SIEM for hot/detection, offload cold retention to the lakehouse), Hybrid-tiered, and Full-replace. The breakeven where each path pays back is computed, not asserted — migration cost divided by the monthly cost-to-serve saving against staying — so a board sees the cheapest path at its own retention horizon and the month at which the call flips. Each recommendation carries a four-part board-defensibility read: the call, what being wrong costs (the reversibility kill-switch), the evidence tier behind the crossover, and the one assumption that flips it. And the recommendation is the lowest risk-adjusted cost: a path that silently breaks a meaningful share of your detections, or fails a mandatory compliance control like WORM, is ineligible to win on cost alone. The method is here; the per-client crossover and the scored gates are the engagement.
How it plays out
The methodology above is the discipline applied inside an engagement. The case studies page is where that work gets shown: right now it carries one close case study, an analysis of Atlassian's Project Banyan Databricks-on-OCSF deployment, with the headline numbers drawn from Atlassian's public Databricks story and DAIS talk. The reference architecture catalog generalizes the published patterns into reusable building blocks.
Beyond that one case study, the catalog carries published-architecture teardowns across the regulated sectors a matrix engagement tends to land in — analyses of named, on-the-record deployments, not SDW engagements: bank (Standard Chartered, DNB, Bank Hapoalim), MSSP (Ziggiz), healthcare (Yale New Haven Health), and SaaS (Cloudflare, Pinterest, Okta, Huntress, Comcast). The full teardown catalog shows each one's pipeline and what's measured versus vendor-reported.
Getting the scored matrix
The scored matrix is delivered inside an engagement, scored against your stack and your workload. The four-phase decision framework, the per-component scoring criteria, the 90-vendor evaluation database, the architecture decision records, and the anonymized case study sit behind a client-materials gate, indexed alongside the public reference catalog so nothing gets lost. To get the scored matrix for your stack, book a scoping call.