
Original framework · Needs validation · 3/5
The ATLAS Wall
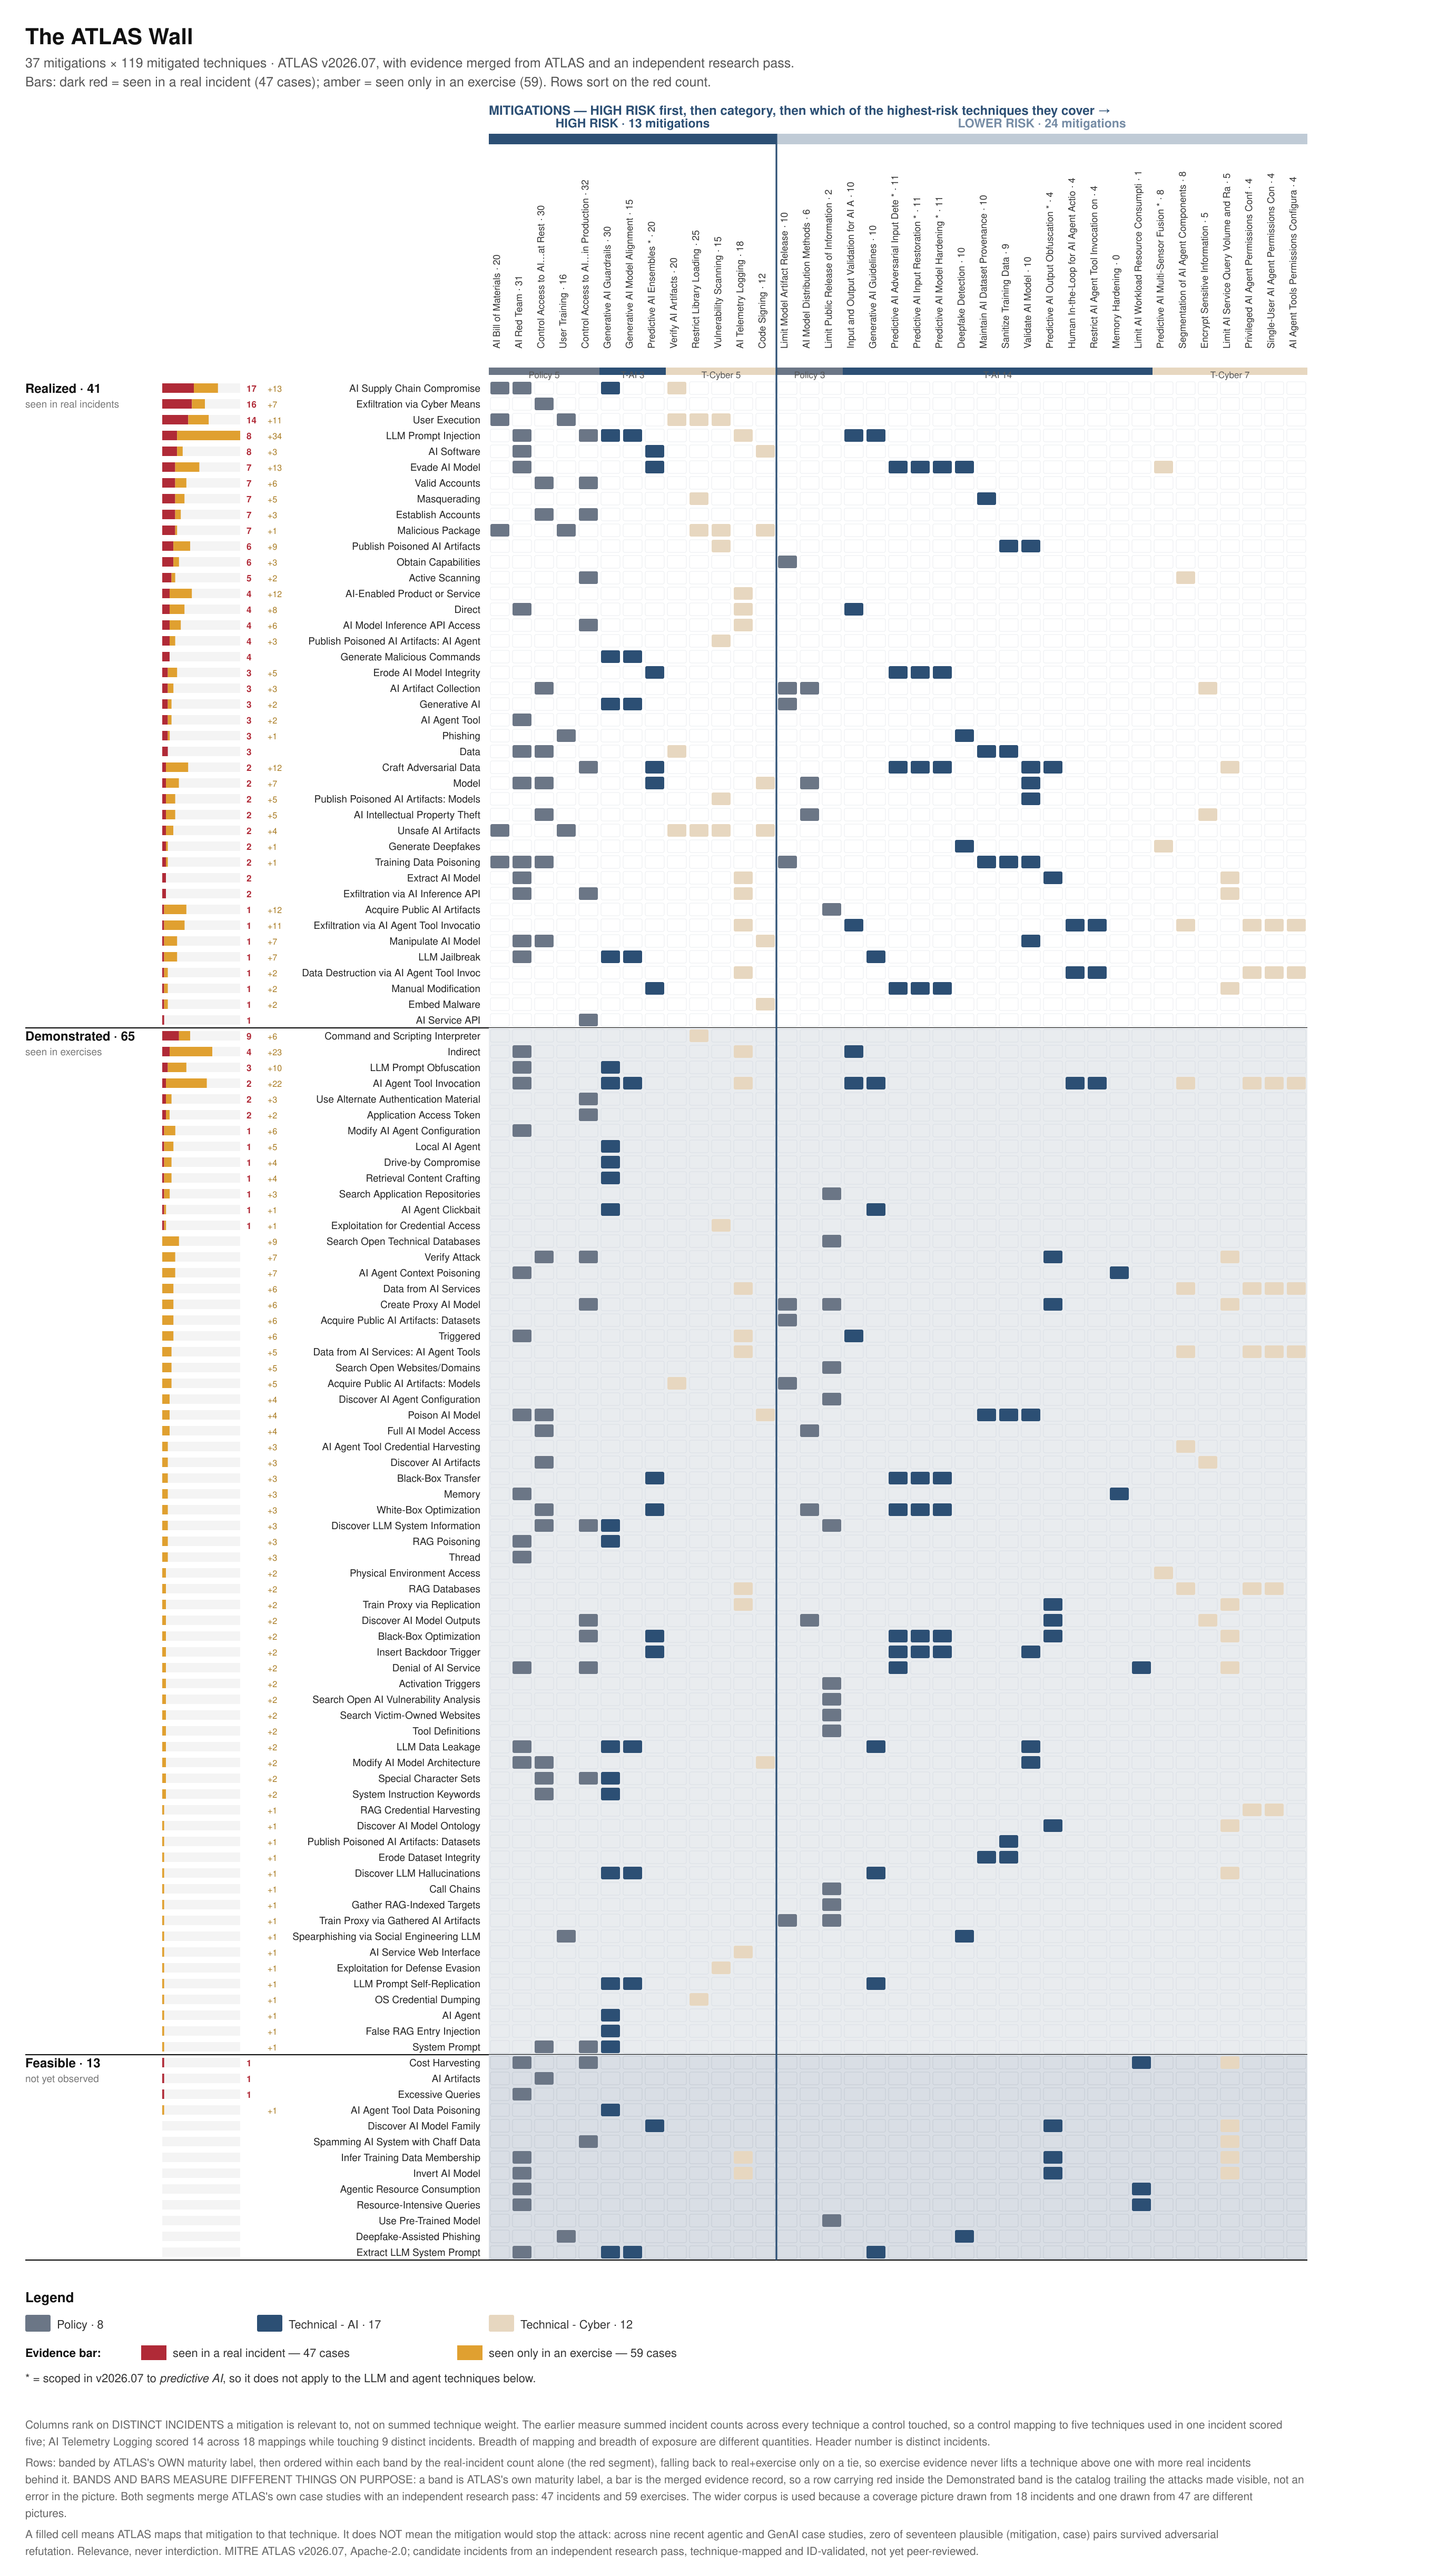
Every mitigation in MITRE ATLAS, which is MITRE's ATT&CK-style catalog of attacks on AI systems, runs across the top, every ATLAS technique runs down the side, and a cell is filled where MITRE maps that mitigation to that technique. When I drew this in July the story was how much of the map was blank. Three weeks later MITRE shipped a release that filled a large part of it in, which moves the useful question from what is missing to what a defender should actually do first, and to the point where buying one more control stops buying anything.
What changed under the map
ATLAS v2026.07 landed on 31 July 2026, one month after v2026.06, and it is a good deal more than housekeeping. The mapping layer went from 247 mitigation-to-technique edges to 338, the number of techniques carrying at least one mapped mitigation went from 76 to 119, and so the blank share of the matrix fell from 56% to 33% in a single release. That is a large enough move that the version of this page I published on 11 July is describing a framework which no longer exists, and it seems better to say that plainly than to quietly restate the numbers and move on.
Two mitigations are new: AI Red Team, which asks for recurring, authorized, threat-informed exercises against AI-enabled systems before deployment and throughout operation, and Limit AI Workload Resource Consumption, which puts bounds on input size, batch size, execution time, memory, compute and output size for a request or an agent workflow. Three techniques covering poisoned datasets, poisoned models and poisoned agent tools were retired into a single AML.T0115 Publish Poisoned AI Artifacts family with sub-techniques, which is exactly the kind of consolidation that silently drops rows out of any analysis still pinned to the old identifiers. It dropped two rows out of mine, and they only came back because the build asserts that every identifier it maps still resolves in the release it claims to be reading.
The change I find most useful is a naming one. Six mitigations now carry Predictive AI in the identifier itself:
- Predictive AI Output Obfuscation
- Predictive AI Model Hardening
- Predictive AI Ensembles
- Predictive AI Multi-Sensor Fusion
- Predictive AI Input Restoration
- Predictive AI Adversarial Input Detection
v2026.07 rewrote both the name and the description of all six to scope them to predictive models, where v2026.06 had stated them generically. The practical effect is that six of the thirty-seven controls in the framework are now explicitly out of scope for generative and agentic systems, so anyone carrying a control catalog built against the older names is carrying six entries that no longer mean what they used to mean. Putting the limit in the identifier was the right call, because the shortened name is what gets copied into a control catalog, and the scope limit needs to travel with it.
What the maturity labels actually measure
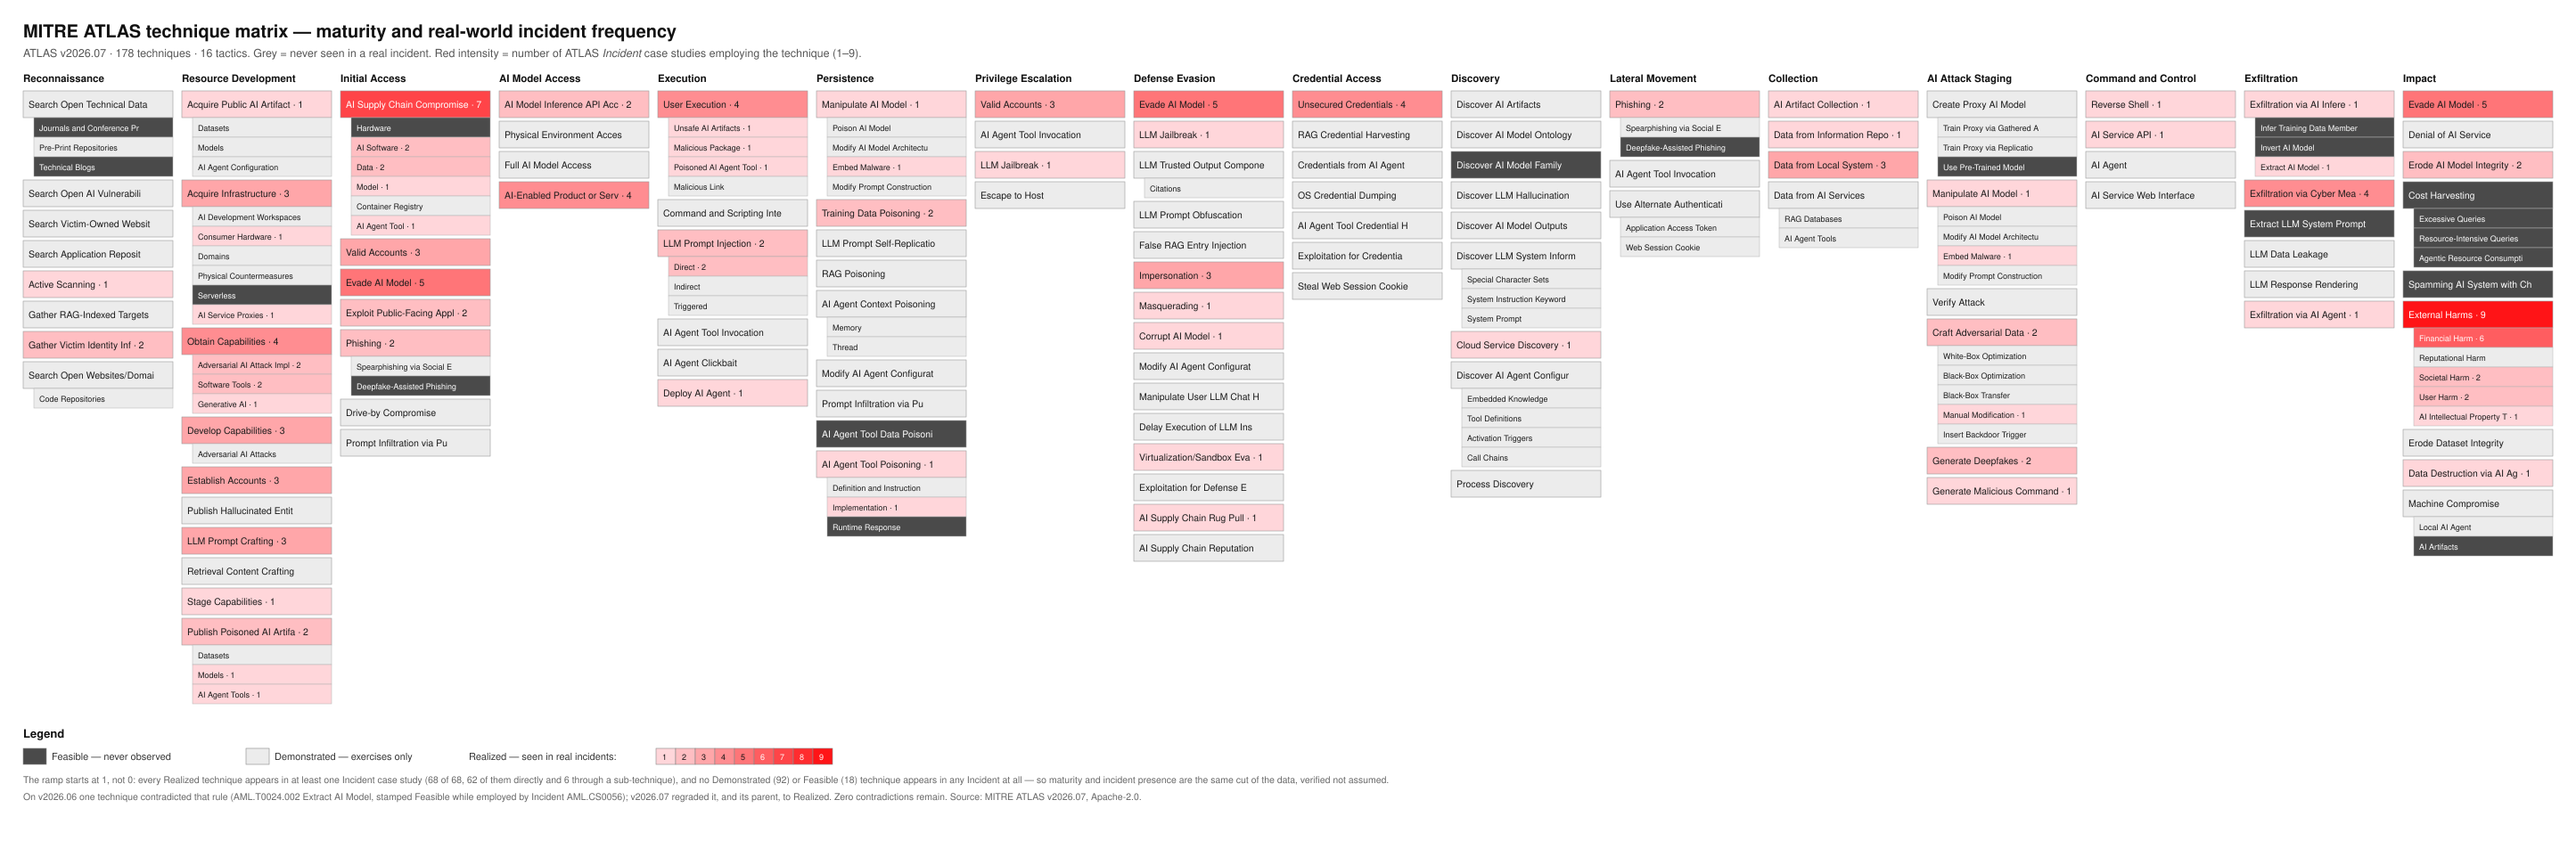
ATLAS stamps every technique with a maturity value of Feasible, Demonstrated or Realized, and it publishes a case-study catalog separately, so it is natural to read those as two independent signals about how real a technique is. They are not independent, and the check that shows it is simple: I compared all 178 techniques in v2026.07 against the whole case-study catalog, and the separation came out exact: every technique ATLAS grades Realized, all 68 of them, appears in at least one case study typed as an Incident, while none of the 92 it grades Demonstrated appears in an Incident at all, and none of the 18 it grades Feasible appears in any case study of either type. So maturity turns out to be the case-study record restated as a label, and not an independent judgment layered on top of it.
That matters because the catalog is mostly not incidents. Of the 68 case studies, 50 are Exercises, meaning red-team or research results, and only 18 are Incidents. So counting how often a technique shows up across all case studies answers a different question from counting how often it shows up in a real attack, and the first count will rank a lab result above a breach. The matrix above is colored on incidents alone for that reason, and the wall's row order uses the same measure.
When I ran this check against v2026.06 in July, one technique broke the rule: AML.T0024.002 Extract AI Model was stamped Feasible while being employed by AML.CS0056, an Incident. v2026.07 regraded it, and its parent, to Realized. Nothing in the current release contradicts the rule, and the build now asserts an empty contradiction set so a future release cannot quietly reintroduce one.
The catalog trails the attacks.
ATLAS added five case studies in v2026.07 and every one of them is an Exercise. The Incident count has been 18 across both releases. I do not read that as a failure of curation, because writing an incident up to a standard where it can be technique-mapped is slow and careful work and the alternative is a catalog nobody can lean on, but it does mean that a defender reading maturity labels in August 2026 is reading a judgment formed against an incident record that has not moved since June.
So I ran a separate research pass across the same window, collecting publicly documented real-world AI security incidents that are not yet in the ATLAS catalog and technique-mapping each one against v2026.07. It returned 29, which takes the incident corpus behind this page from 18 to 47 and the count of distinct techniques with real-incident evidence from 68 to 90. Two exercises that pass surfaced have since appeared in ATLAS as CS0064 and CS0067, which is a small independent check that it was reading the right ground rather than inventing it.
Widening the corpus changes the maturity picture in one specific way, and I want to be careful about what that does and does not show. Measured against ATLAS's own catalog the labels are exactly right, with zero exceptions. Measured against the wider record, 22 techniques that ATLAS grades below Realized turn up in an independently documented real attack, and the sharpest of those is Command and Scripting Interpreter, graded Demonstrated, which appears in nine of the 29. That is a statement about how quickly a curated catalog can move, not a claim that anything was graded wrongly, and the two are worth keeping apart. The practical reading is that Realized means the evidence is already cataloged, and Demonstrated means it is not cataloged yet, which is a considerably weaker statement than not real.
Which techniques actually turn up in attacks
This is the count the wall's row order is built from. The first column is what ATLAS has cataloged, the second is what the research pass added, and the last is how many mitigations ATLAS maps to that technique. The pattern that jumps out is in the last column, because four of the seven techniques appearing in the most real incidents have no mapped mitigation at all.
| Technique | Maturity | In ATLAS | Also found | Total | Mitigations |
|---|---|---|---|---|---|
| External Harms T0048 | Realized | 9 | 10 | 19 | none |
| Unsecured Credentials T0055 | Realized | 4 | 14 | 18 | none |
| AI Supply Chain Compromise T0010 | Realized | 7 | 10 | 17 | 4 |
| Exfiltration via Cyber Means T0025 | Realized | 4 | 12 | 16 | 1 |
| Financial Harm T0048.000 | Realized | 6 | 9 | 15 | none |
| User Execution T0011 | Realized | 4 | 10 | 14 | 5 |
| Exploit Public-Facing Application T0049 | Realized | 2 | 12 | 14 | none |
| Command and Scripting Interpreter T0050 | Demonstrated | 0 | 9 | 9 | 1 |
| LLM Prompt Injection T0051 | Realized | 2 | 6 | 8 | 7 |
| AI Software T0010.001 | Realized | 2 | 6 | 8 | 3 |
| LLM Prompt Crafting T0065 | Realized | 3 | 4 | 7 | none |
| Evade AI Model T0015 | Realized | 5 | 2 | 7 | 7 |
| Valid Accounts T0012 | Realized | 3 | 4 | 7 | 2 |
| Masquerading T0074 | Realized | 1 | 6 | 7 | 2 |
| Establish Accounts T0021 | Realized | 3 | 4 | 7 | 2 |
| Malicious Package T0011.001 | Realized | 1 | 6 | 7 | 5 |
Every technique appearing in seven or more of the merged corpus's 47 real incidents, 16 of 178. Ordered on the realized count, then realized plus demonstrated, the same rule the wall's rows use, and cut at a full tie group rather than a round number. Sub-technique use rolls up to the parent, which is the right treatment for a coverage question and the wrong one for a grading question, so the maturity column is read from ATLAS directly and never inferred from this count.
External Harms and Financial Harm sit at the top with nothing mapped to them, and I read that as defensible on MITRE's part, because those are outcomes rather than actions and you mitigate the thing that causes an outcome instead of the outcome itself. Unsecured Credentials and Exploit Public-Facing Application are a different case. Both are ordinary intrusion techniques imported from ATT&CK, both show up in more real AI incidents than LLM Prompt Injection does, and neither carries a single ATLAS mitigation, so a defender working only from this framework would never be pointed at the credential hygiene and edge-patching that the incident record says are doing most of the damage.
How to read the wall
Rows are the 119 techniques that carry at least one mapped mitigation, because a row with nothing in it tells you nothing about which control to buy and those techniques get their own treatment further down. That filter is why the bands read 41 Realized, 65 Demonstrated and 13 Feasible instead of the 68, 92 and 18 in the full matrix. The rows band by maturity with Realized at the top, and inside a band they sort on the realized count alone, falling back to realized plus demonstrated only when two techniques tie. That ordering rule matters more than it sounds: an earlier version sorted on the two together, which let a technique with a lot of red-team attention outrank one that had actually hurt somebody, and once you are sorting a risk axis that is the wrong way round.
Columns are the 37 mitigations, split into a high-risk and a lower-risk group. Risk here is the number ofdistinct real incidents a mitigation is mapped into, cut at twelve, and distinct is the word doing the work. An earlier version of this page counted differently: it summed incident counts across every technique a control touched, so a control mapped to five techniques that all appeared in one single incident scored five. That inflates exactly the controls which are mapped most enthusiastically, because breadth of mapping and breadth of exposure are different quantities. AI Telemetry Logging is the cautionary case, since the old arithmetic gave it 14 and the incident record gives it nine.
Within each group the columns band by category, Policy then Technical-AI then Technical-Cyber, and inside a band they order as a burndown against the rows, so the leftmost column is the one covering the highest-risk technique, the next covers the highest-risk technique the first one missed, and so on down. The effect is that you read the top-left corner and get controls in the order the incident record says to care about them. I tried ordering columns to maximize mass in the top-left corner instead, which scored better on that metric and read worse, because the metric was measuring a shape while the picture is meant to be read as a sequence.
The bar beside each technique name stacks the two classes of evidence behind it, realized in dark red and exercise-only evidence in amber, and both counts merge ATLAS's own case studies with the research pass, so a technique that has only ever been exercised shows no red at all and a long amber tail. Bands and bars measure different things on purpose, and it is worth saying so before the picture confuses you: a band is ATLAS's own maturity label, a bar is the merged evidence record. Where a row carries red inside the Demonstrated band, you are looking at the catalog trailing the attacks, which is the finding rather than a mistake in the drawing. LLM Prompt Injection is the clearest case, sitting at eight real incidents against thirty-four exercises, and sorting on the red segment alone is what stops that thirty-four lifting it over AI Supply Chain Compromise at seventeen. An asterisk on a column marks a mitigation renamed to Predictive AI in v2026.07.
Where the coverage stops
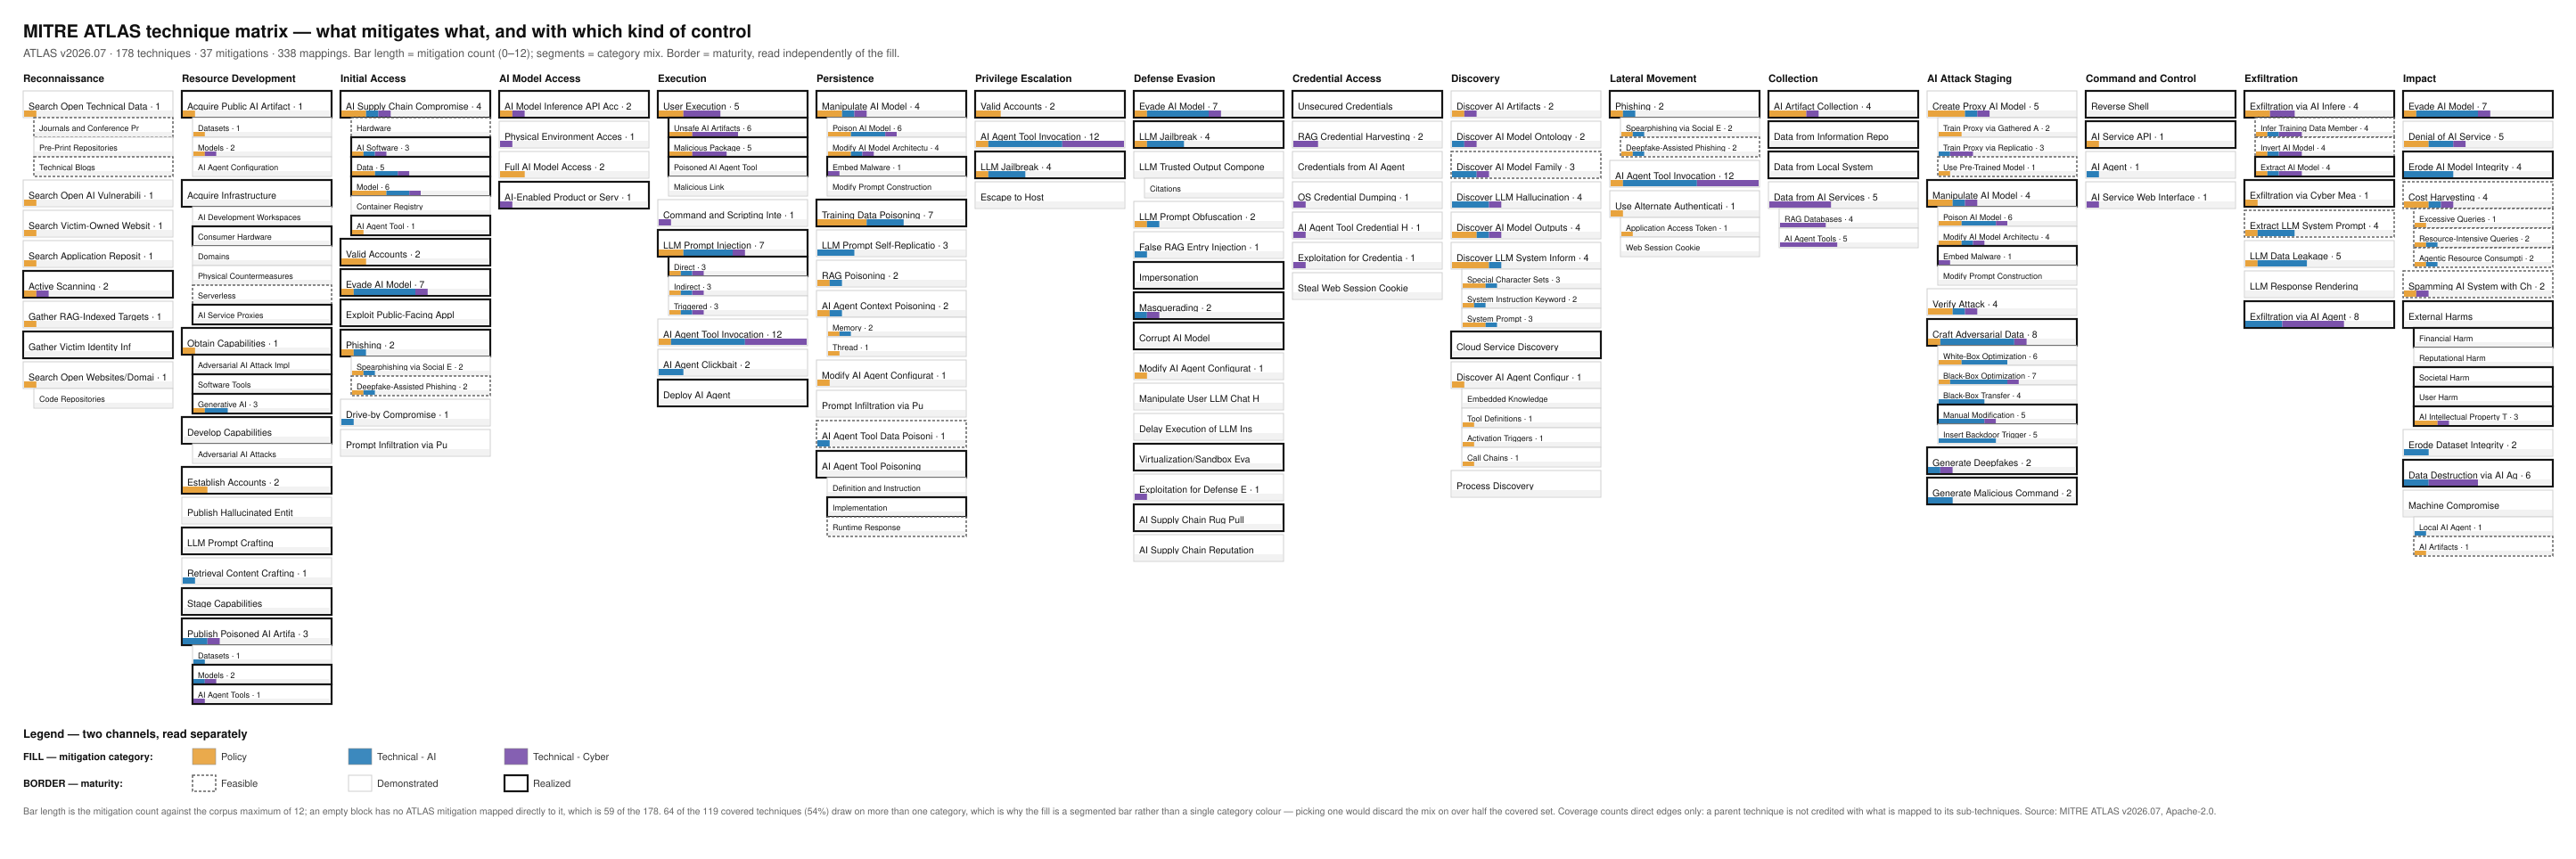
59 of the 178 techniques in v2026.07, a third of the framework, carry no mapped mitigation. The July version of this page reported that as a straight gap and I now think that was overclaiming, because a fair chunk of it is ground a defender has no control surface on in the first place. 21 of those 59 sit only in Resource Development or Impact, meaning adversary-side preparation like acquiring infrastructure or developing capabilities, and outcomes like Financial Harm and Societal Harm. A defender has no control surface over an adversary's decision to rent a server, and an outcome is mitigated by addressing whatever produced it. The grouping is rougher than it sounds, though, because LLM Prompt Crafting sits in Resource Development too and turns up in seven real incidents, so some of that 21 is genuinely out of reach and some of it is only filed on the far side of a line ATLAS drew for other purposes.
That leaves 38 techniques on ground a defender does own, 15 of them Realized, and those are the ones worth being annoyed about. They concentrate in Defense Evasion with nine, Persistence with six, Reconnaissance with five, and Initial Access with four. The fifteen ATLAS itself grades Realized, meaning it has already catalogued them in a real incident, include these:
- AI Agent Tool Poisoning, and its Implementation sub-technique
- AI Supply Chain Rug Pull
- Corrupt AI Model
- Poisoned AI Agent Tool
- Virtualization/Sandbox Evasion
- Reverse Shell
- Unsecured Credentials
That is a list heavily weighted toward the agentic deployments people are shipping right now.
The thinness shows up in the covered half too. Across all 68 Realized techniques the median number of mapped mitigations is one, and 27 of them have none, so even where the map is filled in it is usually filled in with a single suggestion. That is the honest shape of what a defender has to work with: a framework that names the attacks well and, so far, points at a fairly narrow set of answers.
What to deploy first, and where it stops paying
Coverage counted per control is not much use, because the second control you buy is worth what it adds rather than what it covers on its own. So I ran a greedy set cover over the 47-incident corpus, taking the control that reaches the most still-unreached ground, removing that ground, and repeating. The unit is the pair of an incident and a technique employed in it, 360 of them in total, because measuring on whole incidents saturates almost immediately: four controls are relevant to 46 of the 47, since touching one technique in a fifteen-technique intrusion counts the whole intrusion. That saturation is itself worth reporting, because it is why the unit below is the incident-technique pair instead of the whole incident.
| # | Mitigation | Category | Adds | Cumulative | Efficacy evidence |
|---|---|---|---|---|---|
| 1 | AI Red Team | Policy | +72 | 20.0% | no independent assessment |
| 2 | Restrict Library Loading | Technical-Cyber | +39 | 30.8% | no independent assessment |
| 3 | Control Access to AI Models and Data at Rest | Policy | +36 | 40.8% | Supported as hygiene; miscoped |
| 4 | Control Access to AI Models and Data in Production | Policy | +16 | 45.3% | no independent assessment |
| 5 | Vulnerability Scanning | Technical-Cyber | +13 | 48.9% | no independent assessment |
| 6 | Generative AI Guardrails | Technical-AI | +11 | 51.9% | Partially supported, by sub-type |
| 7 | AI Telemetry Logging | Technical-Cyber | +6 | 53.6% | Detection supported, conditionally |
| 8 | Limit Model Artifact Release | Policy | +6 | 55.3% | no independent assessment |
| 9 | Deepfake Detection | Technical-AI | +5 | 56.7% | Effective narrowly |
| 10 | Predictive AI Ensembles | Technical-AI | +4 | 57.8% | Unsupported standalone vs adaptive |
| 11 | Limit Public Release of Information | Policy | +2 | 58.3% | no independent assessment |
| 12 | Code Signing | Technical-Cyber | +1 | 58.6% | no independent assessment |
Every row asserts relevance, never interdiction: no control in this table has been shown to stop an attack, and the one direct test of that gap returned zero of seventeen. Marginal coverage of 360 incident-technique pairs across 47 real incidents. "Adds" is the pairs that control contributes that nothing above it already covers.
Three things fall out of that table, and the first is that the curve is steep at the start and flat by the end, so three controls reach 40.8% of the observed attack surface, six reach 51.9%, and twelve reach 58.6%. Then it stops: 58.6% is the ceiling for the whole framework, because all 37 mitigations together map to 211 of the 360 observed technique-instances and the other 41.4% of what actually happened has no mapped mitigation anywhere in ATLAS. And only twelve of the 37 contribute anything at all, since after the twelfth pick every remaining control is a subset of ground already covered, which means a defender working down the framework by name rather than by marginal coverage will spend a long stretch adding nothing.
None of that is a criticism of the controls below the cut. Several of them have the better efficacy evidence, which is the whole difficulty with reading this table as a shopping list.
Coverage and efficacy are different columns.
I deliberately did not multiply the two together. Folding a judgment-derived efficacy weight into a coverage count produces a single tidy number with a precision neither input has, and the resulting ranking would look authoritative while being mostly an artifact of how I chose the weights. So efficacy rides alongside coverage in that last column, and you read both.
The first thing to notice is how little there is to read. Of the twelve controls carrying the coverage curve, seven have no independent efficacy assessment at all, including the top two, so the honest statement about AI Red Team and Restrict Library Loading is that I could find no published measurement either way, which is not the same as saying they work. That is a different finding from a control being tested and failing, and the two get used differently: the first is a reason to deploy and measure, the second is a reason not to lean on the thing.
Where evidence does exist it splits two ways, with a third group that is a coverage shape rather than a verdict. Some controls carry broad coverage and no measured outcome, so Control Access to AI Models and Data at Rest rests on a mature body of conventional access-control evidence with no measured effect on breach incidence in an AI setting, and its real-world failure mode is misconfiguration, which the control text does not address. And some carry broad coverage with published evidence of no effect in the sub-claim a buyer probably means. The third group is not an evidence category at all but a shape worth noticing: a few controls reach a lot of ground from a small mapped footprint, which is where Restrict Library Loading, Vulnerability Scanning and Code Signing sit, conventional controls pointed at AI-stack intrusions. All three are also in the unassessed seven, so what recommends them is a long track record outside the AI setting and a low deployment cost, and I should not dress that up as measured efficacy here.
Generative AI Guardrails is the case worth spelling out, because the single ATLAS entry enumerates eight distinct implementations in its own description. The deterministic and architectural forms have positive published numbers: in AgentDojo (Debenedetti and colleagues, NeurIPS 2024) a pre-execution tool filter cut targeted attack success from 45.8% to 7.5% while keeping around 66% of benign utility. The statistical filtering forms do not. A systematic 2025 attack study tuned general optimization techniques against twelve recent defenses, including Spotlighting, Prompt Sandwiching, Circuit Breakers, PromptGuard and Model Armor, and pushed attack success above 90% on most of them, where the majority had originally reported near-zero. That study is a preprint rather than a peer-reviewed result and should be weighted accordingly, but the direction is consistent across the independent evaluations I found. Buying "guardrails" without naming the sub-type is how a defender ends up with the half that broke.
Deepfake Detection is the mirror image, a control whose evidence is strong and whose scope is narrower than its name. NIST's 2023 evaluation of 82 passive presentation-attack detection algorithms, IR 8491, put the best performers at an APCER of 0.0 for photo print, replay and silicone-mask attacks while rejecting 1% of genuine users, which is a standards-body measurement at a usable operating point and should be stated without hedging. It is also explicitly not a measurement of the thing most people mean, because NIST records that digital injection attacks, where synthetic media is introduced electronically rather than presented to a camera, were not evaluated, and ISO/IEC 30107-3:2023 scopes them out the same way. The control works against someone holding a printed face up to a camera and says nothing about a video stream substituted upstream of it.
What a mapping actually claims
This is the caveat the whole artifact rests on, so it belongs here instead of in a footnote. A mapping says a mitigation is relevant to a technique, but it does not say the mitigation would have stopped the attack, and ATLAS carries no efficacy measurement to support the stronger reading. I tested that gap directly, though on the previous release rather than this one: across nine recent agentic and generative-AI case studies in v2026.06, 17 mapped pairs of mitigation and case looked like they might plausibly interdict a step, and under an adversarial refuter instructed to default to skepticism, zero of the 17 survived. I have not re-run it against the 91 mapping edges v2026.07 added, so read it as the last measurement I have rather than a current one.
So read a filled cell as "mapped to a real, recent technique" and never as "this would have worked". Everything above answers where attention should go first, but nothing above answers what will stop the attack, and I would sooner hand you a prioritized list with that limit stated than a coverage score that quietly implies more.
Bottom line: the framework got substantially better in one release, it now points at a defensible first six controls, it runs out of things to say at 58.6% of what the incident record contains, and the evidence that any of it works is thinner than the map's confidence suggests.
Method and provenance
Built from MITRE ATLAS v2026.07 (Apache-2.0), fetched 18 August 2026 and pinned, with every figure regenerated from the pinned copy and never from a live query. Retired identifiers are remapped explicitly and the build asserts that each remap target resolves in the current release, which is what stopped two rows disappearing silently when AML.T0058 and AML.T0104 were consolidated into the AML.T0115 family.
On the six mitigations v2026.07 renamed: v2026.06 stated them generically, so Model Hardening read asuse techniques to make AI models robust to adversarial inputs such as adversarial training or network distillation, which a security architect standing up an LLM deployment could quite reasonably have applied to one. Both the name and the description were rewritten. The second cautionary figure behind the distinct-incident correction sits here too: Use Ensemble Methods scored 13 under the old arithmetic across 11 mappings while touching 11 distinct incidents.
The incident corpus is 18 ATLAS case studies typed as Incident plus 29 real-world incidents documented publicly but not yet cataloged, technique-mapped in a separate research pass and then checked back against the ATLAS object graph: 230 candidate mapping rows across 76 distinct techniques, with no invalid identifiers, no technique-name mismatches and no maturity mismatches. Nine mapping rows whose case type the research pass recorded as unclear are excluded from both the incident and the exercise counts, since a case that cannot be typed should not inflate either one. Every primary source behind those 29 resolves, and the most heavily weighted of them are corroborated by reporting independent of the research pass itself. A small number of scale figures inside individual write-ups did not reconcile against their primary sources on review and none of them is used here, since this page uses the corpus only as a count of incidents and of the techniques employed in them.
Efficacy verdicts come from a separate assessment of the published literature and are attached to each recommendation and never folded into any score. Evidence tiers follow A for peer-reviewed research and official standards, B for practitioner and vendor-measured results, C for vendor marketing, D for speculation. Where a control has no assessment I say so instead of inferring one from silence. The Secure Controls Framework is deliberately excluded from the weighting, which keeps this a single-license ATLAS-derived artifact and clean to publish.
