Original framework · Needs validation · 3/5
The D3FEND Wall.
Most security programs can tell you what they detect. Almost none can show you what they don't. The D3FEND Wall is a coverage map built to answer the second question: every defensive technique against every attacker technique, joined through the one thing they have in common, drawn so the shape of your coverage shows and so you can tell a control that would catch an attack from one that only touches the same evidence.
The invisible gap
You can count your detections. You can't see their negative space.
A SOC I worked with had roughly five hundred detection rules. Asked where the holes were, the honest answer was that nobody knew. Coverage there meant a number that went up: rules written, ATT&CK techniques tagged, a heat map that got greener every quarter. None of that measures the thing that matters, which is the attack behavior no control in the stack would ever observe. Gaps don't announce themselves. A technique you have zero coverage for produces zero alerts, which is indistinguishable, on a dashboard, from a technique that never fired because nobody tried it.
The usual fix is to map detections to MITRE ATT&CK and color the matrix. That tells you which attacker techniques you've tagged. It says nothing about whether the tag is doing any real work, and it inverts the question a defender should be asking. ATT&CK is the adversary's catalog. Chasing it means buying tools against a list someone else controls. MITRE D3FEND, released as v1.0 in January 2025 and sitting at v1.4.0 by March 2026, is the other half of the ledger: a knowledge graph of defensive techniques, NSA-funded, structured the same way ATT&CK is. The D3FEND Wall is what you get when you join the two and refuse to look away from the empty cells.
The join
Defense and offense meet at the digital artifact.
D3FEND's quiet contribution is the digital artifact: a shared vocabulary of the things that exist on a system. Network Traffic, DNS Lookup, Process, Executable Binary, Credential, System Configuration Database. A defensive technique relates to artifacts it observes or touches: Network Traffic Analysis analyzes Network Traffic. An offensive technique relates to artifacts it produces. An exfiltration technique produces Outbound Network Traffic, the same artifact Outbound Traffic Filtering watches. The two meet when they share an artifact, which is the whole of the model, and it holds because a control can only catch what leaves evidence it can see.
The join has a nuance that matters, and getting it wrong throws away most of the signal. The two sides name artifacts at different levels of the taxonomy. A defense that watches the general class Network Traffic catches an attack that produces the specific Administrative Network Traffic, because the specific is a subclass of the general. Match on exact identity and you miss it. When I tested it, naive string matching reproduced only 562 of D3FEND's own 1,904 inferred connections, dropping seventy percent of the real coverage. Walking the subclass tree (an attack artifact matches a defense artifact when it equals it or descends from it) reproduces all 1,904, zero missed, and extends them to the techniques D3FEND's published view never showed, so the subclass walk is what keeps the map from being wrong in a way you wouldn't be able to see.
There is a second nuance, and it is the one that catches most attempts at this. Artifacts relate to each other in ways subclass alone doesn't capture. Network Traffic may-contain a Domain Name, so a defense watching Domain Name connects to any attack producing Network Traffic. A Domain Name identifies an IP Address; a File is identified by its hash. Follow those containment and identification links and IP Reputation, Domain Name Reputation, File Hash Reputation, and a whole class of analysis techniques connect to the attacks they should. Match on subclass alone and every one of them sits blank, and that is how a coverage map ends up wrong without showing it, with whole classes of reputation and analysis techniques reading as gaps when they are not.
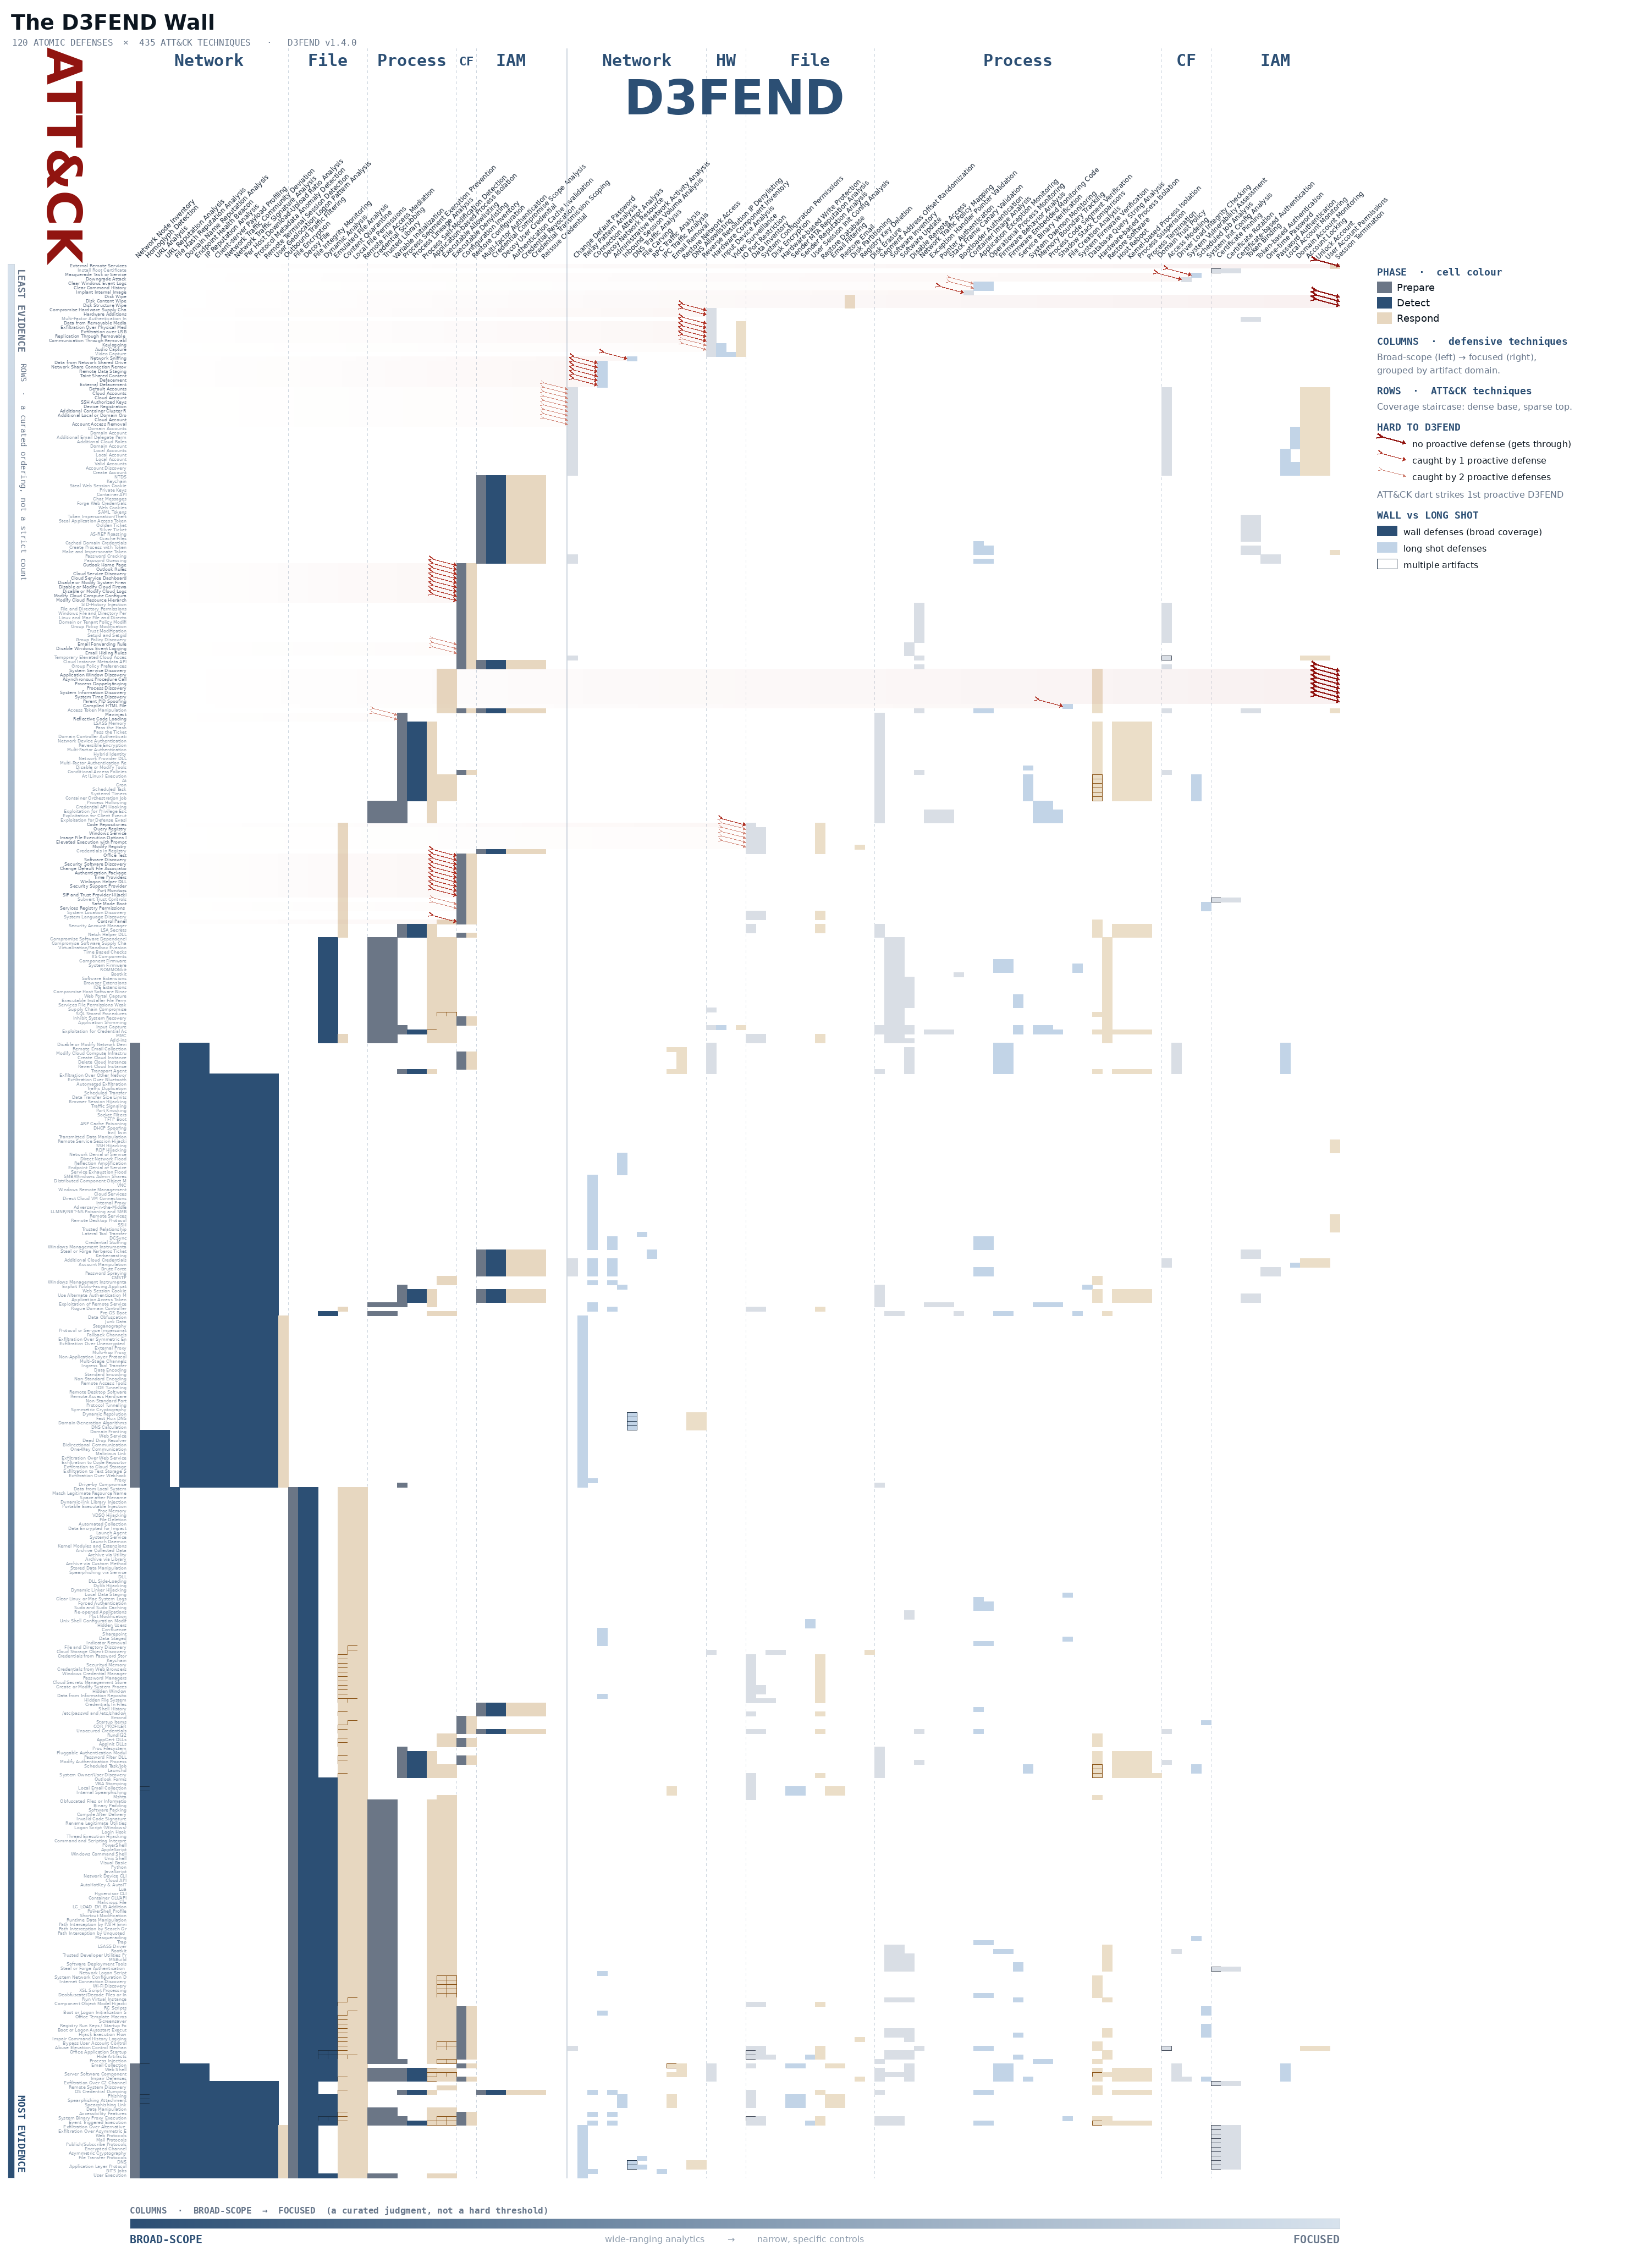
Built against D3FEND v1.4.0: 200 atomic defensive techniques against the 462 ATT&CK techniques that carry artifacts. Two filters clean it up. One defense, Identifier Activity Analysis, shares an artifact with every attack, a coverage that fires for everyone and so discriminates no one; it comes off the wall as noise. With it gone, 27 attacks are left with no artifact any remaining defense watches, so they drop off the grid, which is a fact about where D3FEND has and hasn't mapped defenses rather than a claim those techniques are undefendable in the field, and they sit off the wall for that reason. What remains is 435 attacks against the 120 defenses that cover any of them, 5,616 connections, every relationship pulled from the v1.4.0 ontology, including the network and response techniques (Outbound Traffic Filtering among them) the convenience APIs silently drop.
Reading the wall
A structure, not a heat map.
The left-to-right axis is scope, how much attacker ground each defense covers, broad-scope on the left and focused on the right. That split is a judgment, not a clean coverage threshold; a control can share an artifact with many techniques and still be narrow in what it does, the way process suspension touches half the wall yet detects nothing on its own. Within each side the columns cluster by the artifact family they depend on, network then file then process then configuration then identity then hardware, because the artifact decides what a control can see, and within each cluster they run prepare, then detect, then respond. A technique lands next to the ones it behaves like rather than the ones it's named after. User Geolocation Logon Pattern Analysis reads as an identity control, but its only artifact is Network Traffic, so it sits in the network cluster where it belongs.
The rows are seriated as a staircase against those columns. Each attack sorts by which defenses reach it, read left to right, so the order resolves on the broad network columns first, then file, then process. The payoff is that every broad column's coverage runs as one contiguous block instead of a sprinkle, and the attacks the broad analytics catch many ways sink to the dense base while the ones a single control or two touches rise to the thin top. That base, the solid lower-left, is the wall; the thin top is where you have almost nothing. A red dart marks each attack with two or fewer proactive chances, landing where it first meets a defense that prevents or detects it and reaching the right edge when nothing does, with a faint red trail tying the dart back to its row. The cells carry the same phase colours, with one wrinkle worth its own line: prepare and detect are real defense, respond is cleanup, so an attack reachable only by respond controls sits higher than its raw count would put it.
Two excellence targets
A base to automate and a tail to deploy.
The wall isn't a scorecard with one number to raise, because it holds two different investment decisions in two different regions, and the geometry is what tells you which is which.
Start at the bottom, the dense slab of network, file, and process blocks. These are the broad-scope behavioral analytics, the controls that share an artifact with dozens of attacks each. One at a time they're shallow, because watching Network Traffic is not the same as catching the exfiltration hiding inside it, which the wall draws honestly: a wide dark band where only the bordered cells reach more than a single shared artifact. Being shallow and wide at once is what opens this region to machine learning in a way the narrow focused edge is not, since these are the analytics that watch a pattern of behavior across many techniques at once, and the first place to be excellent is here, making the broad base good rather than merely present, the network and endpoint analytics tuned until breadth stops being a green box on a heat map and starts being detection.
Up and to the right, coverage narrows to the laser-focused specifics. For an attack that matters and that only one control shares an artifact with, that control is the entire defense; there's no breadth to fall back on and no substitute to buy. Excellence here is a per-technique decision. Find the specific attacks you care about whose only cover is a single narrow control, and make sure that control is deployed and tuned, because a gap there is total rather than degraded.
This is the inversion a program needs. Buying against ATT&CK is buying against the attacker's roadmap, a list someone else controls. Building from the D3FEND Wall is ranking your own investments by the ground they actually hold, so what you get is a broad base worth automating and a tail of specifics worth deploying on purpose.
Coverage is not detection
A sixth of the wall is blind.
The wall colours every cell by its defense's phase, prepare then detect then respond, because the bare coverage count flatters, counting every defense that shares an artifact with an attack even though most of those defenses don't detect anything. Hardening makes a technique harder to pull off and response cleans up after it, so only the detect-phase controls see it happen, which is why if you read the teal detect cells alone the wall thins out fast. Of the 435 attacks on the wall, 76, roughly one in six, carry no detection at all: present in the coverage count, lit up with hardening or response, but blind to the attack as it happens.
Zoom into the reddest end of that, the 51 attacks whose only proactive defense, anything that prevents or detects rather than reacts, is a single control or none, which is the wall in miniature, the same staircase and the same phase colours narrowed to the thinnest-covered techniques and split into three sections by what little defense remains.
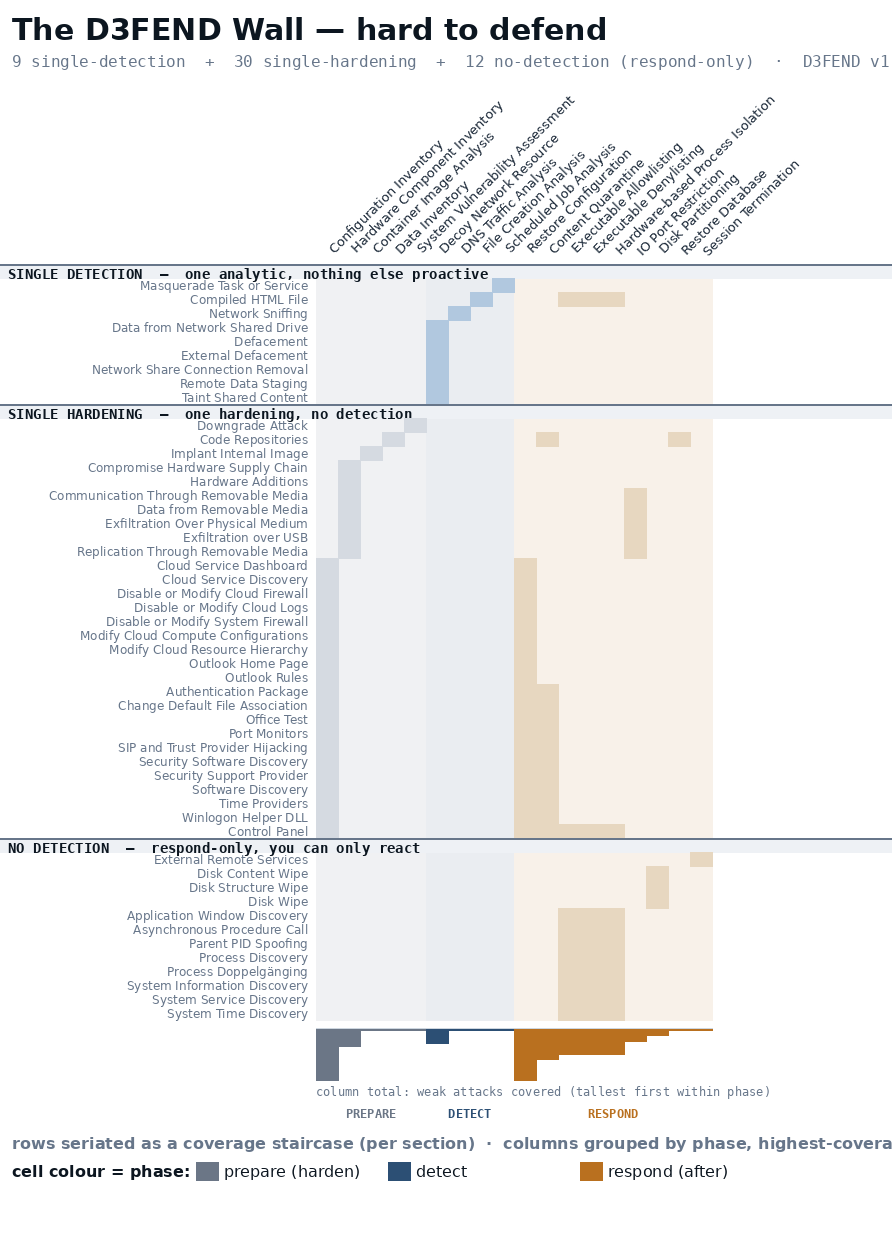
Nine attacks rest on a single detection analytic and nothing else proactive, and losing that one rule blinds you to them. Thirty more have no detection at all, only a hardening control, so you can raise the cost of the technique but never watch it being attempted. And twelve are respond-only, the sole D3FEND answer being to evict or restore after the fact. Read across any row in the lower two sections and you see slate and amber, almost no teal.
The mini wall sorts its columns the way the question demands: grouped by phase, and within each phase the controls that touch the most of these attacks sit leftmost, sized in the bars along the bottom, and that is the read worth acting on, because a few single controls do most of the work at the thin edge and the bottom bars name them, so if you lose or mistune one a cluster of barely-covered attacks goes dark at once.
The correction is to audit by detection, not by coverage. A green cell that resolves to a hardening control or an eviction playbook is not a detection, and counting it as one is how a program persuades itself it can see what it cannot. The wall colours the three phases in the cells themselves, and the teal detect cells are the ones to trust, because they are what survive when you ask the wall to account for detection rather than coverage.
The base is where the models go
Breadth is where machine learning belongs, and we've barely measured whether it works.
If the dense base is shallow-and-wide, watching many behaviors at once and catching each of them only loosely, then it is exactly the region where statistical and machine-learning approaches have the most to offer, far more than the narrow controls at the focused edge where a single rule either fires on a specific artifact or doesn't. A broad-scope network or endpoint analytic is trying to separate normal from anomalous across a wide stream of behavior, which is the kind of problem you give to a model rather than to a signature, so when I say the base is the first place to be excellent I mean that the base is the part of the wall where the work is a data problem and where a good model pays off the most.
That is the claim to be careful with, though, because the base is not one thing. Group the twenty broad-scope detect analytics by the artifact they watch and you get the six families D3FEND already names, and that grouping falls out of the join rather than being imposed, since a base technique is defined by the artifact it consumes. But how each analytic actually decides runs on a different axis that cuts across those families, and when you colour the base by that axis the breadth argument gets more sobering, because two analytics watching the very same network flow can sit at opposite ends of it, one a statistical model of normal and the other a list of known-bad patterns.
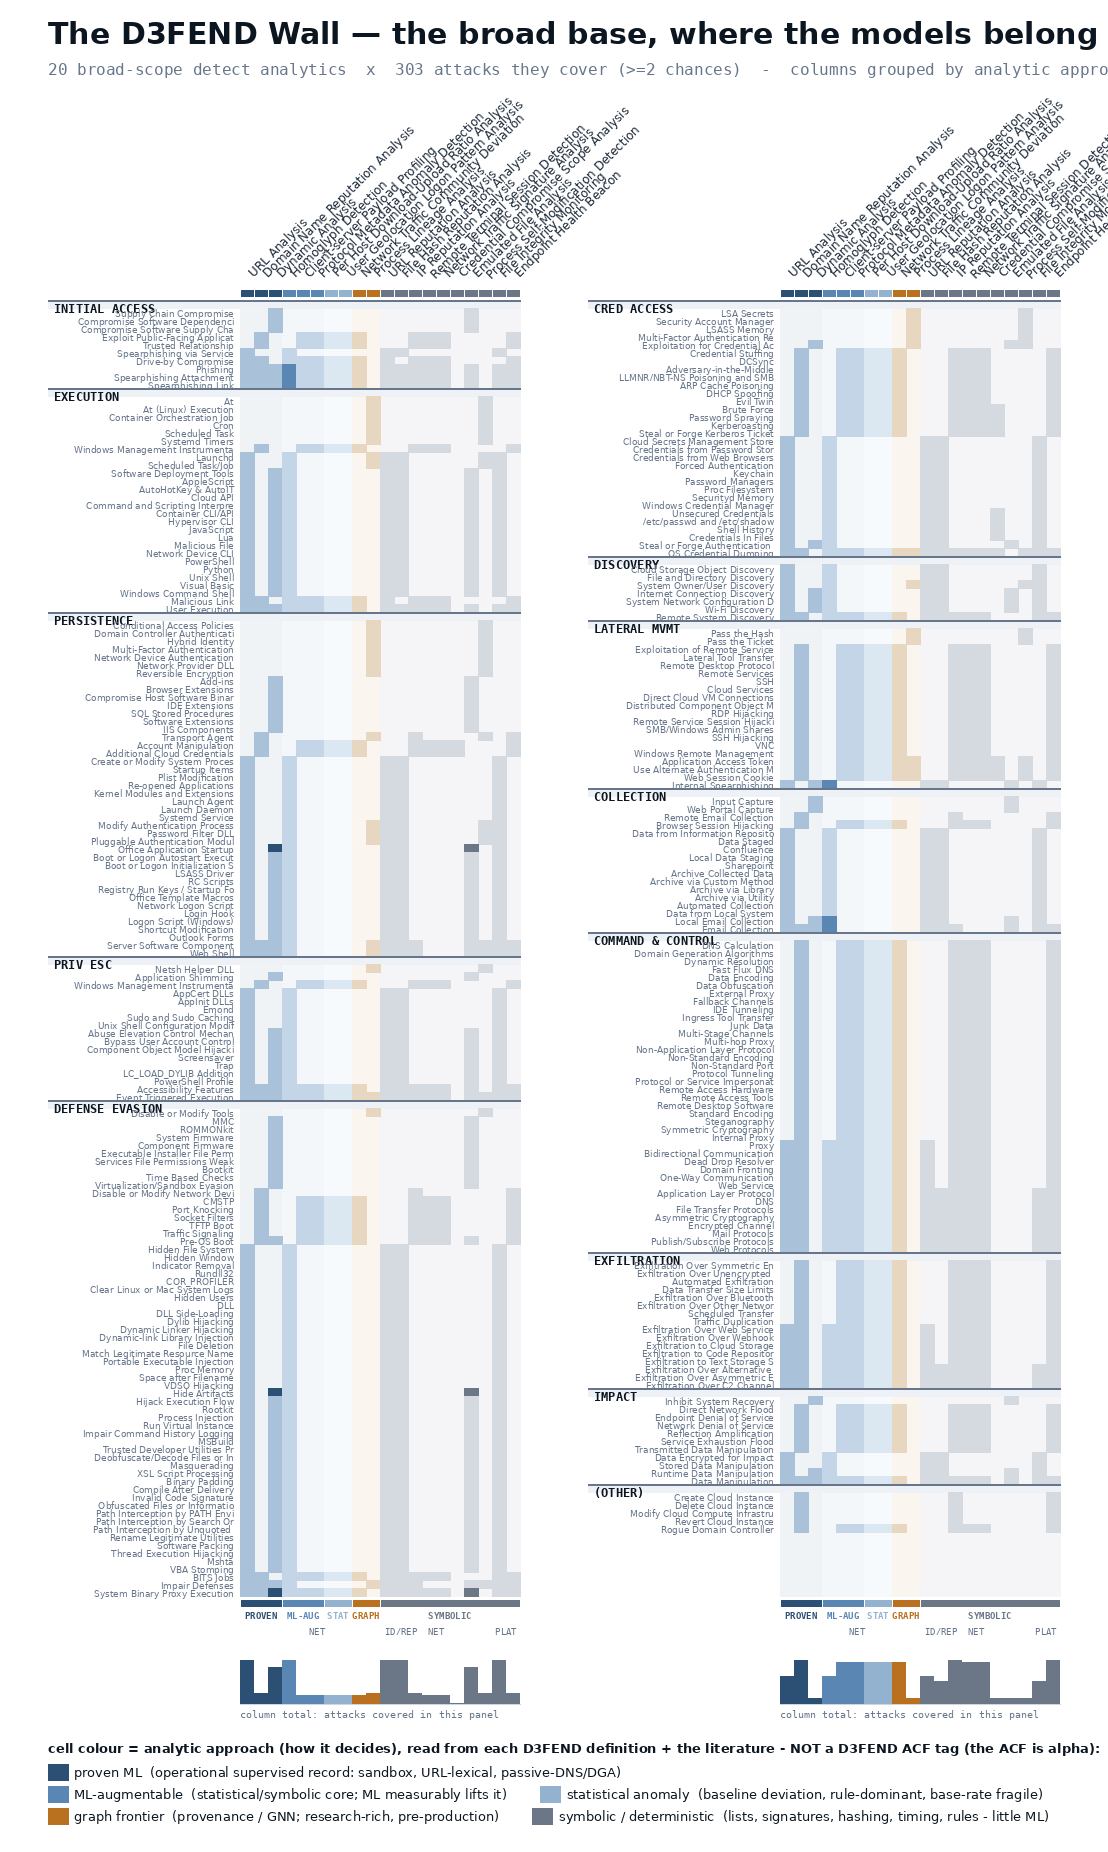
Half of the base, ten of the twenty, turns out to be symbolic or deterministic: reputation lookups that check an indicator against a feed, signature matches, file-integrity hashes, the packet-timing heuristics that have caught interactive shells in traffic since Zhang and Paxson first did it in 2000. None of those gets better with a model, because a hash either matches a known-bad set or it does not, and a blocklist either contains the domain or it does not, so the work there is keeping the list fresh rather than training anything. The split can sit inside a single family: URL Analysis, which judges a URL from its own structure, is a learned classifier, while URL Reputation, which looks the same URL up against a list, is a deterministic check, and the two carry identical coverage on the wall while sitting at opposite ends of the approach axis.
Only three of the twenty have an operational machine-learning record, and they are specific rather than general: sandbox behavioral classification, which has lived in endpoint products for over a decade because malware sandbox traces come with labels at scale, the way Rieck and colleagues were already classifying malware behavior in 2011; URL analysis from lexical features, which Ma and colleagues showed in 2009; and domain reputation built from passive DNS, where Antonakakis's Notos scored domains malicious in 2010, weeks ahead of the blocklists. The rest sit in between, statistical baselines that are rich in research and fragile in operation, or the provenance-graph frontier the academic literature has mined hard without yet leaving its benchmarks for a production SOC. And even where a model does belong, ripe is not solved, which is the part breadth can paper over. Anomaly detection is the hardest place in security to make a model work, for reasons on the record since Sommer and Paxson's 2010 paper that later won a test-of-time award: a model is good at finding what resembles its training data, but detection has to find the novel attack, which inverts the strength, and there is no stable normal to learn. Axelsson named the arithmetic underneath it even earlier, in 2000, the base rate, where real attacks are so rare against benign volume that even a tiny false-positive rate buries the analyst, so the number that binds is the false-positive rate against the base rate and not the headline accuracy, and Arp and colleagues showed in 2022 that the usual evaluation mistakes inflate exactly the accuracy that makes the base look ready.
And knowing that a model could watch a behavior is still not the same as knowing it catches the attacker, and I want to be careful not to let the first claim stand in for the second, because breadth on the wall is a structural fact about coverage while efficacy is an empirical question that the wall does not answer and cannot. Which underlying analytic approach actually works best for a given behavior seems unsettled to me; an unsupervised clustering method, a Bayesian model, a time-series baseline, and a plain logical rule can all be pointed at the same behavioral analysis, and which of them holds up against a real attacker probably depends on the behavior, the data, and the estate, in ways that very little public evidence has actually pinned down.
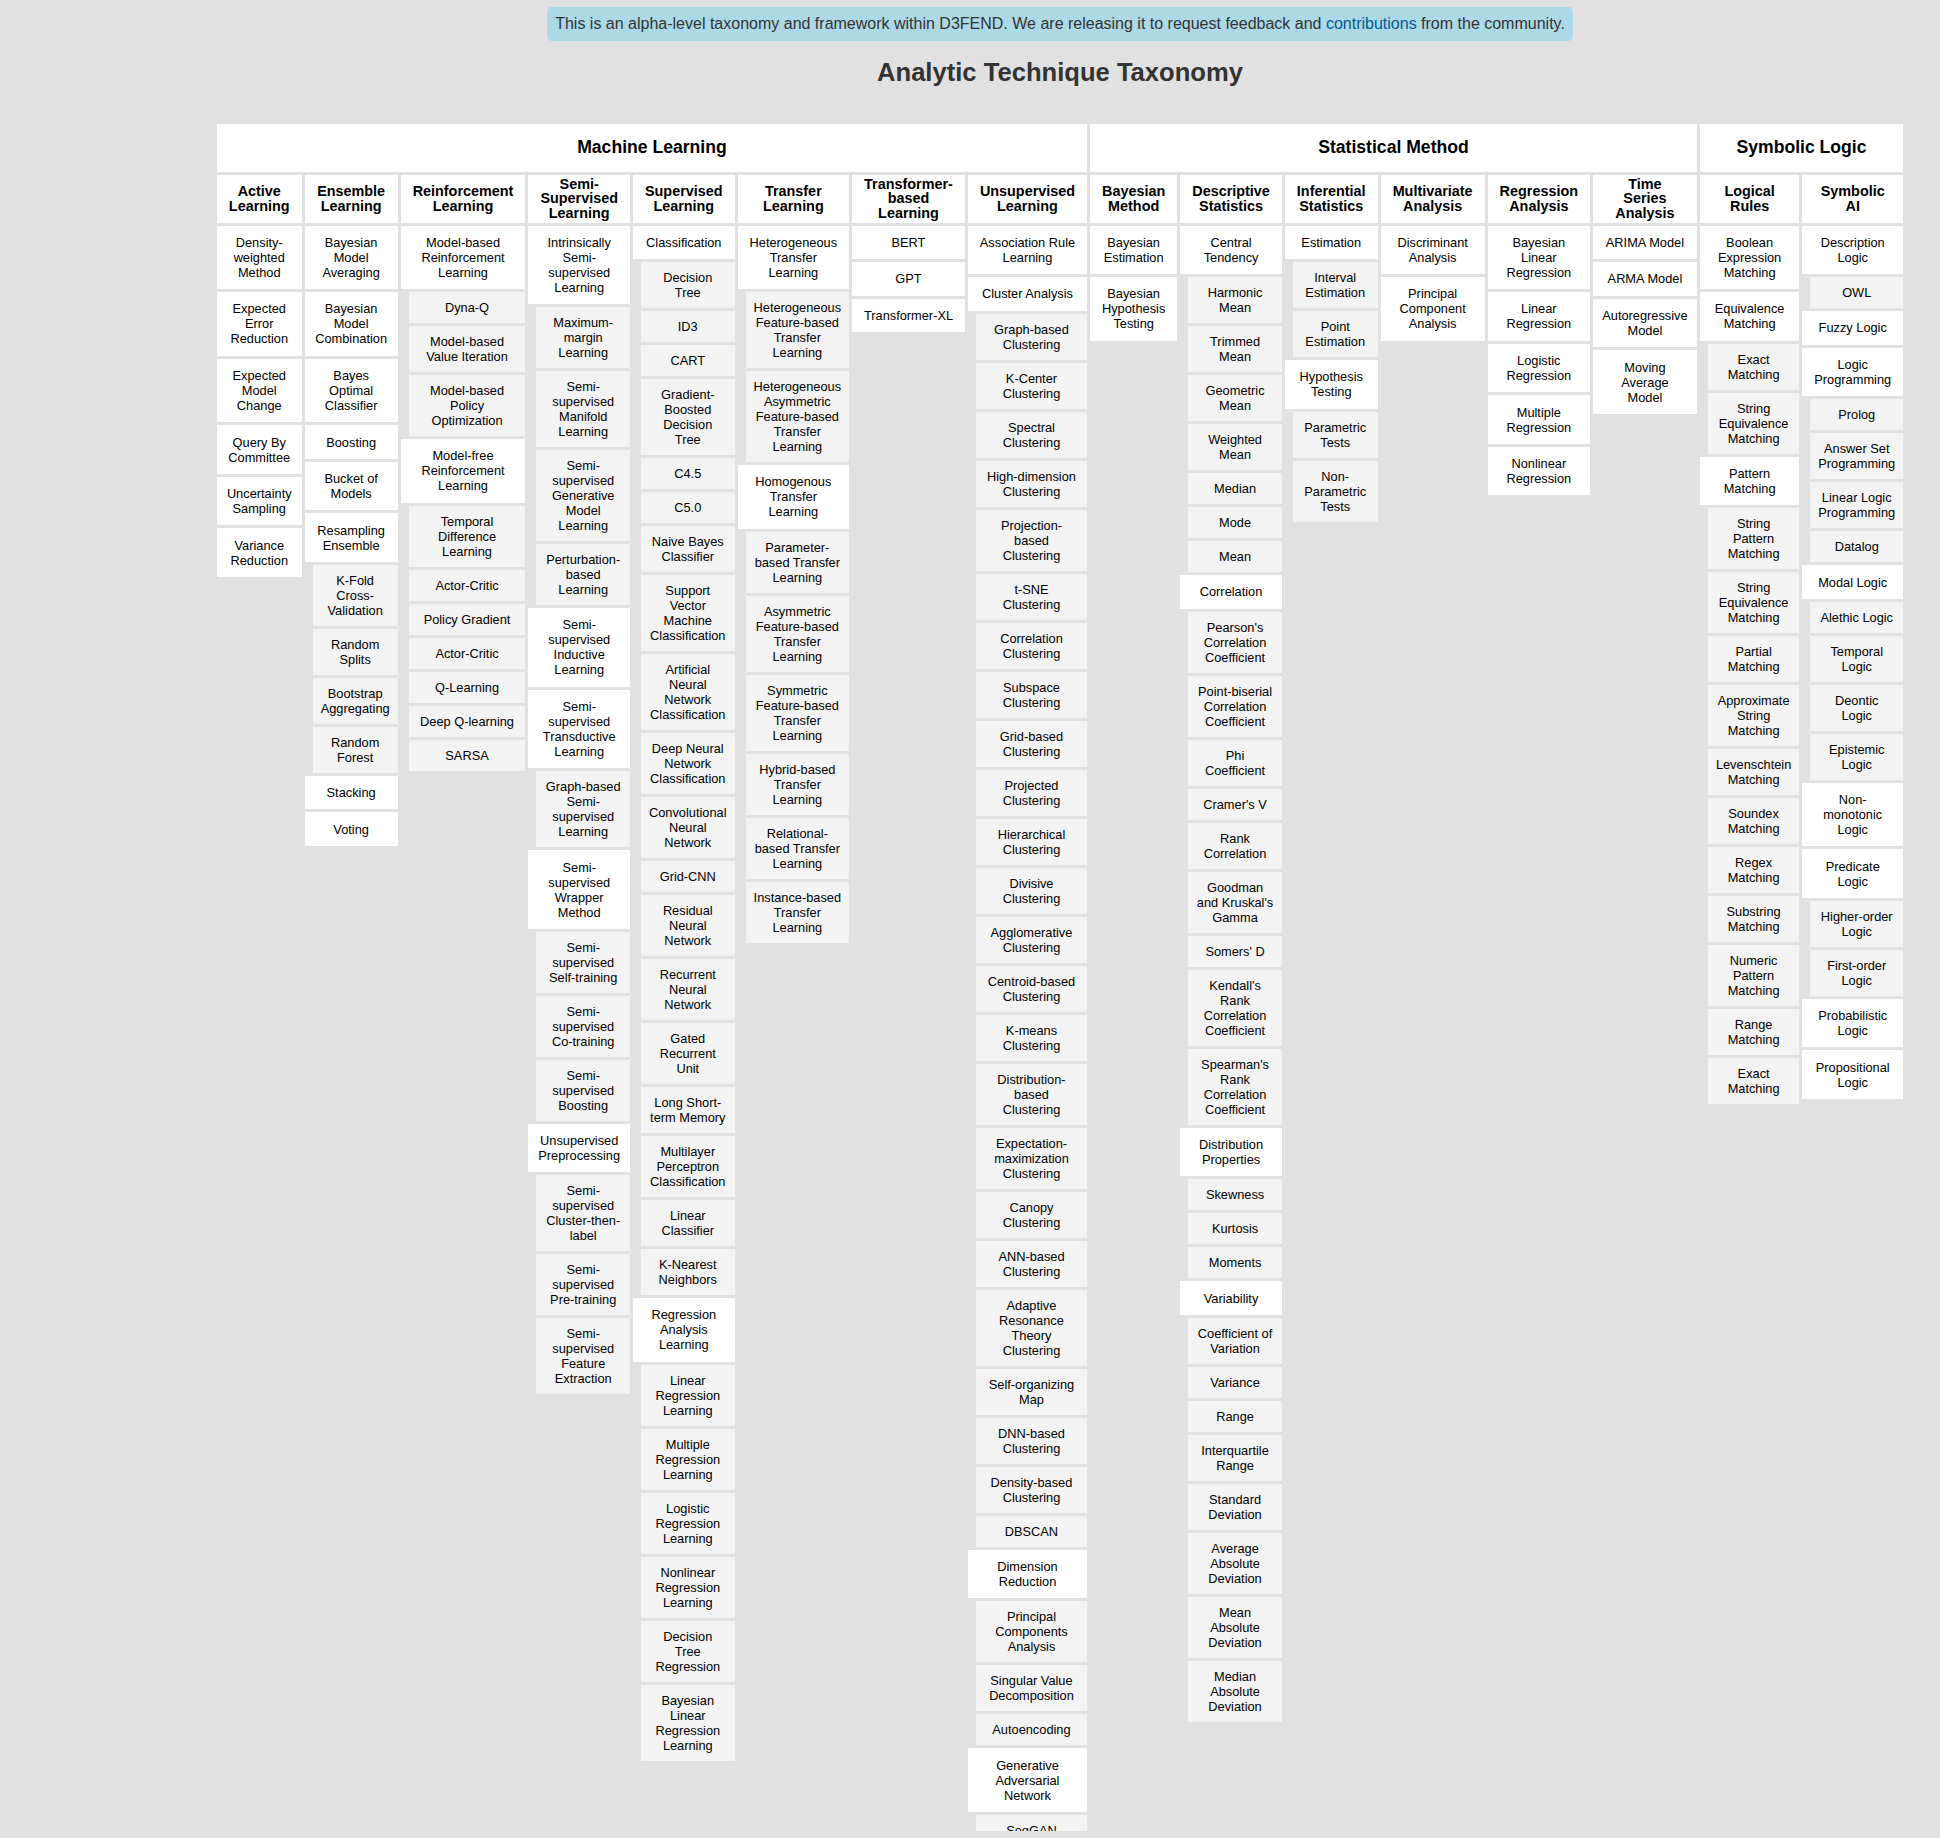
What we have lacked is a shared vocabulary precise enough to even hold that conversation, which is why D3FEND's Analytic Characterization Framework interests me. The ACF is an alpha-level taxonomy inside D3FEND, funded by the Office of the Undersecretary of Defense for Research and Engineering through DTE&A, and it characterizes analytics across three families, so that two people comparing two detection approaches are at least naming the same things. There is Machine Learning (supervised and unsupervised, ensemble, reinforcement, transfer, transformer-based, semi-supervised, active learning), there is Statistical Methods (Bayesian, descriptive, inferential, multivariate, regression, time-series), and there is Symbolic Logic (logical rules, pattern and string matching, fuzzy logic). The framework's own stated position is that complexity is situational, that sometimes a simple approach beats a complex one and other times a complex problem needs a complex approach, and it names its use cases as testing and validation and analysis-of-alternatives, which is to say it exists to make valid comparisons between capabilities rather than to crown a winner.
The hard part is that efficacy cannot be settled by any one organization or vendor on its own, because no single estate sees enough ground truth to know which analytic approach actually works for which behavior, and the incentives cut against honesty in the places that have the most data. A vendor has a clear incentive to claim its approach wins, and a single SOC has only its own traffic, its own tuning, and its own handful of incidents to reason from, so the evidence that would actually answer the question is scattered across estates that don't compare notes. I think the way out is that practitioners have to start talking to each other about efficacy, comparing, in the open but protected, what analytic approaches hold up against which real behaviors, because the question is empirical and the data lives in too many hands for any one of them to answer it alone.
This is what trusted community forums are for, and it is a position I've come around to over a long time rather than one I'm reaching for here. Chatham House Rule venues let practitioners be candid because nothing they say is attributed, and operational collaboratives like JCDC, CISA's Joint Cyber Defense Collaborative, give the public and private sides a place to compare what they actually see. The ACF is the part that makes those comparisons valid instead of apples-to-oranges, because once everyone is characterizing analytics the same way, a claim that one approach beats another can be checked against a claim from a different estate, and its alpha banner invites feedback and contributions from the community, which is the right posture for a vocabulary that only earns its keep if enough people use it the same way.
So I'd rather plant a call here than pretend the answer exists. The ACF is alpha, the efficacy data barely exists yet, and I don't think any one of us can produce it alone, which is the honest state of things and also the reason to start. We have a wall that says where the models belong, a vocabulary that lets us name what those models are doing, and almost no shared evidence yet about which of them catches the attacker, so the next move is for practitioners to begin comparing, carefully and in venues built for candor, what actually works.
Where this stops short
An original framework, still unsettled.
The D3FEND Wall is my construction, not a published methodology, and it inherits every limit of the data underneath it. D3FEND maps a subset of ATT&CK. Roughly 462 techniques carry artifact relationships; over a thousand ATT&CK entries in the ontology carry none, which means they can't be placed on the wall at all. An artifact-sharing relationship is a possibility of coverage, not a guarantee one: that a defense observes the same artifact an attack produces says it could detect it, not that your specific deployment tuned that rule to catch it. The wall measures the structure of coverage, not its quality. I also made one editorial cut a purist would flag. Identifier Activity Analysis maps to every attack in D3FEND's own model, and I dropped it because a universal match carries no information, not because the ontology is wrong to assert it; a reader who wants the raw join should know that choice is mine.
It earns the right to be wrong precisely, which is the standard I hold this kind of work to. The matching rule is validated against D3FEND's own inferred join; the artifact mappings are pulled from the v1.4.0 ontology rather than the convenience endpoints that drop techniques; the empty cells are empty because the framework leaves them empty, not because the extraction missed them. The next step is the one this needs and hasn't had: review against the people who built D3FEND, and a case study that takes a real security estate's deployed detections and tests the wall's central claim, that much of what a program counts as coverage would not, in practice, catch the attack.
One thing has moved since I first drew the wall, and it is a tooling step, not a new claim. The same
offense-defense-control-schema chain now sits behind a small read-only server I can query, scg, a
concept-only graph of 1,442 nodes and 7,618 deduped edges spanning the public spine the wall already draws
from, OCSF and D3FEND and ATT&CK and NIST 800-53 and CCI. What makes it worth mentioning here is that it
carries this section's honesty into the graph itself: every edge is tagged with how well it is actually
supported, from a measured or SKOS-typed link down through a curated mapping to the intent-blind
offense-defense inferences that share an artifact without knowing the attacker meant to produce it, and those
inferred edges are by far the largest class, roughly 6,000 of the 7,618. A multi-hop answer is reported as only
as trustworthy as its weakest edge, so a path that leans on one of those artifact-cooccurrence guesses comes
back flagged as a lead rather than an established fact, which is the possibility-not-guarantee point from above
made queryable instead of asserted. I want to be careful about what that does and doesn't buy, though, because
when I measured it, grounding a model in this graph was close to inert against a plain check that the field
mapping was schema-valid, and the graph's structure changed a retrieval answer on only one of nine
incident-reconstruction cases. So the server is honest navigation with provenance, not a way to make a model
more accurate, and the overlap with MITRE and CTID's own mappings is deliberate. The contribution is the
provenance layer and the measured brittleness, not a rival map.