
The well-connected pillar
The assurance gap no single tool closes.
Every security tool holds a partial, slightly wrong view of your estate, and the part you can actually trust is the part where the tools agree. I built a benchmark to measure how much of the truth the cross-tool view recovers over the best single tool, how much stays dark no matter how many tools you own, and how much of that residual is really a join problem rather than a coverage one.
Reading time: about 10 minutes. Evidence tier: B — reproducible and first-party, run on a controlled synthetic estate with planted ground truth, not on production telemetry. The transferable claim is the ordering, not the specific percentages, and I spend a section showing why.
The question
Which tool knows the truth about an asset?
Ask a simple question across a SOC and watch the answers diverge. Who owns this host? The CMDB says one name, but the record is six weeks stale. What OS is it running? The endpoint agent knows, if the host is managed, and is silent if it isn't. Is it exposed? The scanner has an opinion from whenever it last reached that subnet. Each tool is authoritative on the attributes it was built to hold and blind or stale on the rest, so the question that matters for assurance is what fraction of the estate's true state any of them actually recovers.
That is the well-connected pillar stated as a measurement. The claim I wanted to test is that assurance lives in the cross-tool view rather than in any single console, that combining the tools recovers materially more truth than the best one alone, and that a residual always remains that no combination recovers, because nothing in the stack actually holds it. The residual is the part worth paying attention to, because it is the risk surface you can't see by logging into any one product.
The setup
A planted estate you can re-run.
Production telemetry can't answer this question, because you never know the ground truth — that is the whole problem. So I planted one. The benchmark builds a synthetic estate of 20,000 assets carrying 7 attributes each, which is 140,000 ground-truth cells whose correct value is known by construction, then observes that estate through four source tools the way a real stack would: a CMDB, an endpoint agent (EDR), a vulnerability scanner, and an identity provider, 191,835 observation rows in total. Each tool sees the estate through its own flaw model, where the CMDB's volatile inventory goes stale on a window, the EDR only covers managed endpoints, and the scanner is partial and cadence-stale, and every number below is an exact set cardinality over the planted truth, so this is a correctness and coverage benchmark, not a latency one.
It runs on DuckDB 1.5.3 from a fixed seed, two in-process runs come back byte-identical, and the code is public so you can clone it and change the flaw parameters yourself. That last part matters more than it looks, because the headline percentages are functions of those parameters, and the honest test is whether the conclusion survives moving them.
One tool at a time
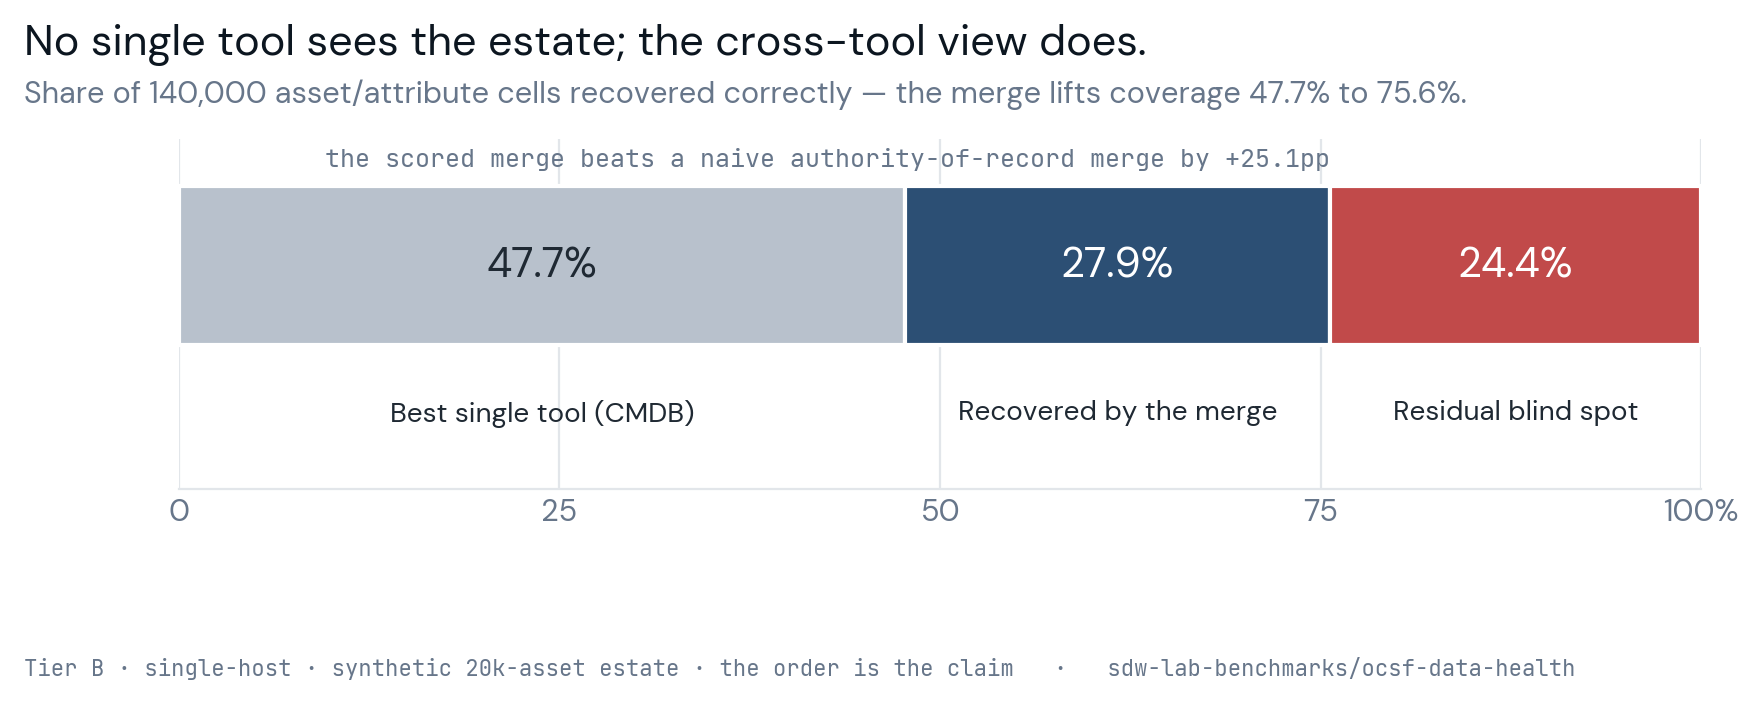
No single tool clears half the estate.
Scoring each tool on its own, against the full estate rather than just the attributes it specializes in, the best single source is the CMDB at 47.7% recovery, and it gets there while being correct only 61% of the time on the cells it does report — coverage and staleness both drag it down. The endpoint agent recovers 42.8% and is right every time it speaks, because it only reports what it directly observes, but it is blind to everything unmanaged. The scanner recovers 2.8% and the identity provider 4.9%, each narrow by design.
| tool | recovery | accuracy where reported |
|---|---|---|
cmdb | 47.7% | 61.0% |
edr | 42.8% | 100.0% |
vuln | 2.8% | 25.6% |
idp | 4.9% | 100.0% |
What the per-tool numbers show is that no single console knows half of what is true about the estate it is supposed to be securing. Anyone who has tried to answer an auditor from one tool already feels this; the benchmark just puts a number on it.
The cross-tool view
Combining the tools, and combining them well.
Merging the four tools recovers 75.6% of the estate's true state against the best single tool's 47.7%, a 27.9-point lift, which is the central claim made measurable, that assurance lives in the cross-tool view rather than in any single console. But there is a second effect underneath it that is easy to miss, and it is the difference between merging tools and merging them well. A naive merge that simply trusts each attribute's system of record recovers only 50.5%, because the system of record is often the stale one — the CMDB is the named authority for an asset's IP and OS, but the endpoint agent holds the fresh value. The merge that picks the highest freshness-decayed confidence per cell, demoting the stale authority in favor of the fresh observation, is what gets to 75.6%. So the lift decomposes: about a quarter of it is having more than one tool, and the larger part is scoring the observations by freshness rather than by org chart.
The benchmark is careful about where the merge cannot help. On an attribute only one tool ever holds, like the vulnerability count, the cross-tool recovery equals the single-tool recovery, because a merge can't invent coverage no source has. Naming that honestly is part of the result: the cross-tool view wins where tools overlap and disagree, not everywhere, and a benchmark that claimed otherwise would be less believable, not more.
The residual
The 24% nothing covers.
The merge tops out at 75.6%, which means 34,126 of the 140,000 cells, 24.4% of the estate's true state, are reported correctly by no tool at all. That residual is the actual risk surface: the shadow-cloud host no console onboarded, the network device the endpoint agent can't see and the CMDB last touched weeks ago, the vulnerability count no recent scan covered. No merge recovers it, because the information isn't in the stack to recover — only adding a source that covers it can close it.
Quantifying that gap is the point of the exercise. A team can know its tool count and its license spend exactly and still have no number for how much of its estate it actually has assurance over. The cross-tool measurement gives that number, and the residual is the part a security architect should care about most, because it is invisible from inside any single product they already own.
Does the order survive the sweep?
The percentages move; the ordering doesn't.
The 75.6% is a tuned-point number. Change how stale the CMDB is or how much each tool covers and it moves, which is exactly why quoting it as a constant would be dishonest. At the fixed canonical configuration it is at least reproducible rather than a lucky draw — re-generating the synthetic estate across twelve random seeds holds it to a tight band, 47.4% and 75.4% on average give or take about two tenths of a point, a coefficient of variation of 0.3%, so the canonical 47.7 / 75.6 sits at the top edge of a stable distribution rather than standing alone. The question worth pressing, then, is not run-to-run noise but how the result moves when you change the inputs that actually matter. So rather than assert one tuned figure, the benchmark sweeps the two parameters that genuinely move the result, a staleness multiplier and a per-tool coverage multiplier, across a nine-point grid and recomputes every measure at each point. Across the whole grid the cross-tool recovery ranges from 69.4% to 78.5% and the best single tool from 45.5% to 52.1%, and the three orderings the thesis rests on never invert: cross-tool always beats the best single tool (the smallest margin anywhere in the grid is still +19.4%), a residual gap always remains, and the freshness-scored merge always beats the naive authority merge. The magnitudes are corpus parameters; the ordering is a property of the mechanism, and that is the part that transfers off the synthetic estate.
One swept axis turned out to do nothing, and it is worth reporting the null rather than hiding it. I swept the freshness half-life from 7 to 90 days and the result didn't move, because on this estate the freshest source is also the highest-confidence one, so decay never flips a per-cell winner. On an estate where the freshest source were the lower-confidence one, the half-life would bite; here it doesn't, and pretending the axis mattered would be the dishonest move.
Identities are harder
When the join key is contested.
The asset case has one clean join key every tool shares, so the cross-tool merge is a clean equi-join. Identity data is the harder, more realistic case, because the four tools key on different and disagreeing columns: HR on an employee ID, the IdP on email, the endpoint agent on a UPN, the directory on a SAM account name, and no single column joins all four. Before the merge can recover any attribute it has to reconcile which records are the same person, which is entity resolution, and that step has a measurable cost. On a planted identity estate of 12,000 people, the clean-key version that joins on the true person ID recovers 96.3%, while the contested-key version that only ever sees the disagreeing key values and has to link records by their overlap recovers 86.2%, a 10.1-point resolution tax. The naive shortcut of just picking one join key collapses to 60%, because every tool that doesn't expose that key falls out of the join entirely.
That tax is the part of the assurance gap that is a join problem, not a coverage one: the attributes are present, but a fraction of identities can't be linked across the tools that hold them. The resolver over-merged zero people and fragmented 3,770 across more than one cluster, the legacy accounts with no shared bridge key, and both failure modes cost recovery. A contested join key is itself a piece of the gap, which is why entity resolution belongs in any honest assurance review and why "we have a CMDB" is not the same as "we can answer questions across our tools."
Honesty boundary
What this is and isn't.
This is Tier B: reproducible, first-party, single-host, and synthetic. The flaw models, meaning the CMDB staleness window, the endpoint agent's managed-only coverage, the scanner cadence, and the per-key missing and garbled rates for identities, are corpus parameters rather than universal constants, and the magnitudes move if you move them. The benchmark does not show real-world rates, a specific vendor's resolution accuracy, or that any particular linker is optimal. What it shows is that the ordering holds across the swept parameters and that contesting the join key degrades recovery by a measurable, non-trivial amount. The honest, transferable findings are the three that survive the whole grid: a cross-tool view recovers more truth than the best single tool, a residual blind spot always remains, and a freshness-aware score beats trusting the system of record.
I have an obvious incentive to want the cross-tool story to be true, because it argues for the kind of assurance work I do, so the guardrails are the point: the sweep rather than a single tuned figure, the reported null on the freshness axis, the attributes where the merge honestly can't help, and the code in the open so you can move the parameters and watch the ordering hold or break on your own assumptions.
What it means
The assurance review on your estate.
The benchmark is the public, synthetic version of a question worth answering on a real estate: how much of your true state do your tools recover together, where is the residual nothing covers, and how much of the gap is a contested join key rather than missing coverage. The method is open and the code is yours to re-run; the version that scores your actual tools, prices the residual against the risk it represents, and names which source would close the most of it is the assurance review an engagement delivers. The number that matters is rarely the headline recovery; it is the residual, because that is the part you are carrying without knowing it.
This is the well-connected pillar with a measurement under it, and the two numbers a stack can actually be held to are how much of the estate the tools recover together and how much of it stays dark no matter how many consoles you own.