
Technology deep-dive
ClickHouse at petabyte scale.
Netflix ingests 5 PB/day of logs at 10.6 million events per second, and at a July 2025 ClickHouse meetup one of their engineers walked through exactly how they made ClickHouse keep up: fingerprinting, native protocol, tag sharding. Read as a security-architecture document, that talk is a blueprint, not a curiosity. Huntress already ran the same playbook and took 93% off its Elastic bill.
The Netflix and Huntress numbers below are production-measured (Tier A). The Hydrolix comparison rests on vendor documentation and my own architectural reading (Tier C), and I flag where it has no petabyte-scale public case study to stand on.
The scale problem
5 PB/day. 10.6 million events per second. 40,000 microservices.
Every SOC I've worked in eventually arrives at the same sentence: "we need to collect everything," meaning network logs, endpoint telemetry, cloud audit trails, application events, and a fresh source every quarter. The sentence is cheap to say, but what rarely gets costed out in the meeting is the day "everything" turns into 5 petabytes a day.
That figure is not a stress-test hypothetical. It is Netflix's steady state: 10.6 million events per second on average, peaking at 12.5 million, across more than 40,000 microservices serving 300 million subscribers. A security estate is smaller, but the engineering problem at the top of the curve is the same one, and Netflix has already published its answers.
I have felt the other end of this curve, the small end where the SIEM can't answer. During one incident an analyst came to me certain something was wrong and unable to prove it. The evidence was there; the SIEM infrastructure just couldn't run the queries the investigation needed across the duration and depth of data involved. It took over a month, most of it raw data-wrangling, and the fix was to pull the relevant data into custom key-value stores inside the SIEM so the long-window, deep queries would actually finish. The analyst's instinct was right the whole time; what stood between them and proving it was an engine that couldn't interrogate its own data at the depth the investigation demanded. That is the performant pillar stated as a month of a person's life, and it is the thing a columnar engine over lakehouse storage exists to prevent.
Why ClickHouse
Why columnar wins at security analytics.
Look at the questions an analyst actually asks during an incident. "Show me all authentication failures from this IP in the last hour." "Which users touched this sensitive resource in the past week?" "Aggregate event counts by source, by hour, for the last 30 days." Every one of those scans millions of rows and reads a handful of columns. That access pattern is the whole argument for column storage, and it describes most of security analytics.
A row-oriented engine like PostgreSQL or MySQL pulls the full row off disk even when the query wants 2 of 50 columns. At a few gigabytes that waste is invisible. At a petabyte it is the dominant cost of every query, because you are paying I/O on 48 columns you discard.
Columnar engines (ClickHouse, DuckDB, Apache Druid) store each column contiguously, so a query for
timestamp and source_ip reads two columns and stops. The wins compound from
there. In my own OCSF-event benchmark the columnar layout plus ZSTD-22 compression lands an 8.2×
reduction in stored size, and the column-pruned scan returns the
narrow-column queries above in sub-second time where the document store takes 30 seconds, which is the
before/after pair Huntress measured and I cite in full later. I'd rather give you those two anchored
figures than a "5–100× faster" banner, because the multiplier you get depends entirely on how many
columns your query touches.
Most teams I talk to are wedged between three bad options. A schema-on-read SIEM gives excellent analytics and a brutal bill: a market-leading SIEM at 1 TB/day runs past $1.5M a year. Elasticsearch holds up under roughly 1 TB/day and then the shard-and-heap overhead grows faster than the data does, a failure mode I walk through in the next section. A hand-rolled data lake is powerful and expensive to operate, which is a different way to spend the money. The pattern Netflix validated, a columnar engine over lakehouse storage, is the one that displaces all three at petabyte scale.
The Elastic problem
Why Elasticsearch struggles past 1 TB/day.
Huntress, running 3 million endpoints, moved off Elastic to ClickHouse and cut its cost 93%, and a number that large isn't a tuning win so much as the signature of an architectural mismatch, which the three subsections below break into the three places the mismatch lives.
Document-oriented storage overhead
Elasticsearch stores data as JSON documents with inverted indices for full-text search, and because every field is indexed by default the storage overhead climbs fast, so a 500-byte security event becomes 2–5 KB stored, a 4–10× overhead.
Shard management overhead
As data grows you need thousands of shards, and each shard is a Lucene index carrying overhead for segment files, merge operations, refresh cycles, and 2–3 GB heap memory minimum. At TB/day scale 1,000+ shards per cluster is common, which means 2–3 TB RAM minimum, and shard rebalancing during failures drags the cluster toward instability. Huntress saw query latency degrade from 3s to 30s as shard count grew, plus 10–30 second JVM garbage collection pauses.
Heap pressure at scale
Elasticsearch is Java-based, so it leans on JVM heap memory for the field-data cache (aggregations on high-cardinality fields), request caches, and shard metadata, and aggregations on IP addresses, user IDs, and file paths build field-data structures that get large quickly. The practical max heap is 31–32 GB per node, because beyond that compressed pointers are disabled, and GC pauses grow with heap size.
When to migrate
None of this is a reason to rip Elasticsearch out by reflex. It stays the right tool under roughly 1 TB/day, when full-text search across unstructured text is genuinely the workload, when the team already carries deep Elastic expertise, and when ECS plus the Elastic Security rule content is the detection backbone you'd otherwise have to rebuild.
The case to migrate sharpens as those conditions invert. Above 1 TB/day, with structured or semi-structured logs (JSON, Syslog, CEF) dominating, where aggregation queries matter more than full-text relevance, and where the symptoms above are already showing (query latency creeping up, shard management eating an engineer's week), the math moves. I'd put the threshold concretely: once Elastic infrastructure clears $15–30K/month, the ClickHouse footprint that carries the same ingest runs about 2–4× cheaper on the cost table later in this piece (the Huntress estate landed at 14×, but that is the high end, not the median you should plan around).
Netflix's three optimizations
Three bottlenecks, three fixes.
Daniel Muino, an engineer at Netflix, walked through the company's ClickHouse optimization work at a July 2025 ClickHouse meetup. What makes the talk useful rather than a victory lap is that he named the three bottlenecks specifically and put a measured before-and-after on each fix. I'll take them in the order they appear in the pipeline: how a log gets parsed, how it gets written, and how it gets queried.
1. Fingerprinting: 216 µs → 23 µs
Log fingerprinting (categorizing log types for routing and analysis) was too slow, and the initial attempts using regex and machine learning models didn't scale. The fix was to generate lexers with JFlex (a Java tool that produces optimized tokenizers), so instead of pattern matching at runtime the parsing logic precompiles into efficient state machines, which got them 8–10× throughput and brought fingerprinting time from 216 µs to 23 µs. The lesson for security is that generated parsers beat regex for EDR / Sysmon / CloudTrail normalization.
2. Serialization: JDBC → native protocol
The initial implementation used JDBC batch inserts, and JDBC carries overhead in connection pooling, SQL parsing, and protocol translation, all of which compounds at 10M+ events/sec. Netflix switched to RowBinary first, which was better, then reverse-engineered the ClickHouse Go client and built a custom native protocol encoder generating LZ4-compressed blocks directly. The lesson for security is that generic APIs like HTTP and JDBC become bottlenecks at high event rates, so you reach for native protocols or Kafka connectors instead.
3. Query performance: 3 s → 700 ms via tag sharding
Netflix stores tags (key-value metadata like
region=us-west-2, service=auth-api) as maps. Queries filtering by tags
required linear scans through map structures. At petabyte scale, a single query could take 3+ seconds.
The fix was to shard tag maps into 31 smaller maps (one per tag-key namespace), so instead of scanning one massive map the query reads only the relevant shard.
The filtering query went from 3 s to 1.3 s (2.3× faster) and filter-plus-projection from 3 s to 700 ms (4.3× faster), with data scanned reduced 5–8×. The lesson for security is that security data is rich with metadata (source IPs, ports, usernames, hashes), and storing it as JSON blobs or maps is intuitive but slow, so partition the metadata by access pattern rather than packing everything into one giant map.
Hot + cold tiering
Match storage cost to query frequency.
Security data decays in value on a curve you can almost set your watch by. The first week is live: active investigations that need sub-second response. Days 7 to 30 are incident follow-up, queried often but not constantly. The 30-to-90 window is trend analysis and compliance reporting. Past 90 days it is forensics and legal holds, the data you must keep and will rarely touch.
Most teams flatten that curve into a single tier, either an expensive SIEM holding cold data at hot prices or a slow data lake serving hot queries at cold latency. The temperature-tier pattern keeps hot data in ClickHouse and ages cold data into Iceberg behind one read contract, so the analyst sees a single table and the storage bill follows the access pattern instead of the volume. Holding all 5 PB in ClickHouse for a year would be untenable on cost alone; moving data to Iceberg after 30 days drops the per-byte storage cost roughly an order of magnitude (Netflix's own framing is "do the least amount of work") while the cold tier stays queryable through the same engine.
The architecture pattern:
Architecture pattern · query engines on Iceberg
ClickHouse isn't Netflix's monolithic database. It's a specialized query engine layered on top of Iceberg's lakehouse foundation. Iceberg provides storage durability, ACID guarantees, and schema evolution. ClickHouse provides sub-second query performance for specific workload patterns (scheduled reports, high-throughput aggregations).
Security translation
Where Netflix patterns apply directly.
EDR telemetry at scale
Modern EDR agents collect process execution, file access, network connections, registry modifications, and DLL loads, so 50,000 endpoints × 1,000 events/endpoint/day works out to 50M events/day, roughly 500 GB/day compressed. Netflix's fingerprinting lesson (216 µs → 23 µs) applies straight across to EDR log parsing, where generated parsers replace regex for normalization, and the ClickHouse advantage shows up in queries like "all PowerShell executions with network activity" that scan only 2 columns instead of entire event records.
Network flow data (NetFlow, Zeek, Suricata)
10 Gbps × 24 hours comes to roughly 100M flows/day and 1 TB/day uncompressed. Netflix's tag sharding (3 s → 700 ms) applies to flow metadata, where you shard by source_ip, dest_ip, and port for faster threat hunting, so aggregations like "top 100 internal hosts by external connections" complete in under a second versus 30+ seconds in Elasticsearch.
Cloud audit logs (CloudTrail, Azure Activity, GCP Audit)
5,000 AWS accounts × 10,000 API calls/day = 50M events/day, roughly 200 GB/day. This is where the hot + cold split pays for itself: CloudTrail past 30 days is rarely touched, so it ages to Iceberg for compliance retention while incident work stays on the last 7 days in the hot tier at sub-second latency. The year-plus audit query runs against the cold Iceberg tier and nobody pays hot prices to keep it around.
Application security logs (WAF, API Gateway, authentication)
1,000 microservices × 100K requests/day comes to 100M events/day, roughly 300 GB/day. Netflix's native protocol lesson applies here too, so you use the ClickHouse Kafka connector for real-time WAF log ingestion, and queries like "failed auth attempts by user, last 24 hours" come back fast enough for active incident response.
The four cases rhyme because the underlying query is the same one: aggregate over a high-cardinality field (IPs, usernames, file hashes, process names) and read a few columns to do it. That is the shape ClickHouse is built around and the shape a document store with per-field inverted indices fights against, which is why the same workload that strains Elasticsearch is unremarkable here.
Cost
5 TB/day: ClickHouse vs. schema-on-read SIEM vs. Elastic.
Here is the comparison at a scale a large enterprise SOC actually hits: 5 TB/day of ingest, 1.825 PB stored over a year. The ranges are wide because pricing is, and I've kept the assumptions visible below the table rather than buried.
| Platform | Annual cost |
|---|---|
| Schema-on-read SIEM | $2.74M – $5.48M |
| Elastic Cloud | $438K – $876K |
| ClickHouse (self-hosted) | $142K – $200K |
| ClickHouse Cloud | $200K – $300K |
Assumptions: schema-on-read SIEM pricing from community reports ($3–6/GB/day enterprise). Elastic from public calculator (hot tier 30 days + warm 335 days). ClickHouse self-hosted: 10–15× c5.4xlarge instances + S3 + 2–3 FTE ops. ClickHouse Cloud: vendor public estimates.
Read off the table, ClickHouse comes in 5–27× under a schema-on-read SIEM and 2–4× under Elastic at 5 TB/day, with the spread driven by self-hosted versus managed and by where each vendor's tiering lands. The gap is roughly linear in volume, so at 50 TB/day the same architecture is a $2–5M-a-year line item rather than a rounding error. I'd treat the low end of each range as the planning number; the high end assumes self-hosting and the 2–3 FTE of operations that comes with it.
Huntress migration
93% cost reduction in 8 months.
The headline numbers from Huntress's 2024 migration across 3 million endpoints are the kind I trust because they include the unglamorous denominators. The bill went from $70K/month to $5K/month, the 93% and roughly $780K a year that anchors this whole essay. The replacement infrastructure sustained up to 200,000 records per second on a handful of servers, not a cluster you'd describe as large. Compression took terabytes down to dozens of gigabytes, and queries over billions of events came back sub-second. What I find more instructive than any single figure is the shape of the project, because it's the part teams underestimate.
One caution I'd attach to all of this, from my own lab and pointed at the ClickHouse family rather
than away from it, is that fast is not the same as correct and the difference is invisible by default.
Testing chDB (the embedded ClickHouse engine) against DuckDB over byte-identical Parquet, I had chDB
return a filtered count(*) short of the right answer, silently, with no error raised,
because of an equality-filter undercount in the newer Parquet reader's Bloom-filter pushdown. It's one
engine at one version on one class of query — chDB 4.1.8's embedded ClickHouse 26.3.9.1, filed upstream
(chdb-io/chdb#587) and
already fixed in ClickHouse 26.5, so it's a version-scoped regression rather than current behavior, not
a reason to distrust ClickHouse — but it is the reason I run a cross-engine answer-equality check before
I trust any of these throughput numbers, because a timing-only benchmark would have recorded that wrong
answer as a win. I work through the case in
the query engine returned the wrong answer.
It ran in three phases over eight months. The first two were planning and proof-of-concept: architecture design, vendor evaluation, and a single data source (EDR logs) migrated far enough to confirm ClickHouse queries came back 5–10× faster than the Elastic baseline they were replacing. The middle three months were the parallel run, which is where the risk actually gets retired. Both systems took writes at once so data consistency could be checked against ground truth, analyst dashboards were rebuilt, the SOC was trained, and the exit gate was behavioral rather than technical: analysts had to reach for ClickHouse on 80% of investigative queries before anyone touched the cutover.
The final three months were cutover and tuning. Elastic ingestion stopped, the ClickHouse side got the attention that only matters once it's load-bearing (compression codecs, partitioning, the tiering scheme), the 90%-plus cost reduction was confirmed against real bills, and the Elastic cluster was decommissioned. Two people carried the whole thing: one data engineer, one security engineer. The reason it didn't blow up the SOC is structural, because the parallel run buys confidence before anything is torn out, so the disruptive step is the last one and the smallest.
Materialized views
When to accelerate vs. when to query raw.
A ClickHouse materialized view trades storage for query time on a pattern you run repeatedly. The acceleration is real, but I want to put a measured number on it rather than wave at a range. The worked example below is a concrete one: an auth-failure aggregation that scans 50 GB and 50M raw events in 3–10 seconds collapses to a 500 MB pre-aggregated scan in 50–200 ms, a 20–100× speedup for a storage overhead of about 1%. The economics only work when the pattern actually repeats, so that repetition is the thing you're really deciding on.
-- Base table (raw security events)
CREATE TABLE security_events (
    timestamp DateTime,
    source_ip String,
    user_id String,
    event_type String,
    payload String
) ENGINE = MergeTree()
PARTITION BY toYYYYMM(timestamp)
ORDER BY (timestamp, source_ip);

-- Materialized view (pre-aggregated authentication failures)
CREATE MATERIALIZED VIEW auth_failures_hourly
ENGINE = SummingMergeTree()
PARTITION BY toYYYYMM(timestamp)
ORDER BY (timestamp_hour, source_ip, user_id)
AS SELECT
    toStartOfHour(timestamp) as timestamp_hour,
    source_ip,
    user_id,
    countIf(event_type = 'auth_failure') as failure_count,
    countIf(event_type = 'auth_success') as success_count
FROM security_events
GROUP BY timestamp_hour, source_ip, user_id;
That SummingMergeTree definition is the whole mechanism: it pre-rolls the hourly failure
and success counts as events land, so the dashboard reads the 500 MB view instead of re-scanning the
50 GB base table. The 3–10 seconds becomes 50–200 ms for the 1% storage cost noted above. The judgment
call is which patterns deserve a view, and that splits cleanly.
Materialize when
- Repeated dashboard queries (SOC dashboards refreshing every 5 minutes = 288 times/day).
- High-frequency aggregations (queries scanning billions of events repeatedly).
- Known query patterns (MITRE ATT&CK dashboards: 30+ queries on same raw data).
Don't materialize when
- Exploratory threat hunting (unknown patterns, ad-hoc queries).
- Rare queries (compliance reports run monthly).
- Low-volume data (MV overhead exceeds benefit).
Worked economics for one auth-failure dashboard at 288 refreshes/day run $86.40/day ($2,592/month) without the MV and $2.94/day ($88/month) with it, which is a 97% reduction on a single dashboard, and across 20–30 production dashboards that comes to about $600K/year in savings from materialized views for known query patterns.
Netflix's likely approach: materialized views for high-frequency dashboards (auth failures, service health, error rates) plus raw queries for exploratory analysis (fingerprinting new log types, ad-hoc threat hunting).
Threat hunting patterns
What queries actually look like.
Pattern 1: behavioral analytics over time windows
-- Detect users with 10+ failed logins followed by successful login (credential stuffing)
SELECT user_id, COUNT(*) as failed_attempts
FROM auth_logs
WHERE event_time > now() - INTERVAL 1 HOUR
  AND auth_result = 'failure'
GROUP BY user_id
HAVING failed_attempts >= 10
  AND user_id IN (
    SELECT user_id FROM auth_logs
    WHERE event_time > now() - INTERVAL 1 HOUR
      AND auth_result = 'success'
  );
ClickHouse runs this in under 500 ms on 1B+ auth events, where the Elasticsearch equivalent takes 30+ seconds.
Pattern 2: rare event detection
-- Find rarely-seen processes executed on multiple hosts (lateral movement)
WITH process_frequency AS (
  SELECT process_name, COUNT(DISTINCT host_id) as host_count
  FROM edr_logs
  WHERE event_time > now() - INTERVAL 7 DAYS
  GROUP BY process_name
)
SELECT * FROM process_frequency
WHERE host_count >= 5
  AND process_name NOT IN (SELECT process FROM known_good_processes)
ORDER BY host_count DESC;
Aggregations over billions of EDR events complete in seconds, which is fast enough that the threat hunting stays interactive.
Hydrolix trade-offs
Where a log-specific architecture wins.
Moving security logs off a SIEM into a columnar engine forces one structural choice. Flatten the schema and you lose the hierarchical semantics (I argue against doing this by default in the flattening anti-pattern essay); preserve the structure and you pay for it in query complexity. Hydrolix is built around the second answer (log data, high cardinality, nested by design), so it's the right foil for ClickHouse here. Four differences decide most cases.
Architectural differences
The first is how the two handle the read/write contention that bites during an incident. Hydrolix is Kubernetes-native and stateless, with ingest, query, and merge scaling as separate pools. ClickHouse shares resources across reads and writes, so a heavy MergeTree merge can starve the very queries an analyst is running. When logs are flooding in mid-incident, exactly when you're querying hardest, Hydrolix holds query latency steady where ClickHouse can wobble.
The second is cardinality. Hydrolix is designed for "hundreds of thousands of columns" with full indexing as the default posture, while ClickHouse reaches comparable ground only with deliberate codec selection per high-cardinality field. Security logs are about as high-cardinality as data gets (IPs, usernames, file paths, hashes), so Hydrolix arrives tuned for the workload and ClickHouse asks you to tune it.
The third is nesting. Hydrolix stores arrays of maps in catch-all fields and queries into them with JSON Pointer syntax, leaving flattening optional. ClickHouse has Nested types, but the query gets more involved as the structure deepens. CloudTrail and Azure AD records, which nest several levels, read naturally in Hydrolix without an explicit flattening step.
The fourth runs the other way and favors ClickHouse. Its JOIN support is full SQL, dictionary and distributed joins included. Hydrolix offers native joins too, but timestamp-based and fussy about aliases and exact type matching. For multi-table correlation, the bread and butter of detection engineering, ClickHouse is the more flexible engine, though the lab's scored join bench (Tier B, single host, 10M–60M-row tables) adds a caveat worth carrying: the run's only DNF was ClickHouse's own native MergeTree table on one of the TPC-H-derived joins, over 300 seconds on both attempts, while the same engine over Iceberg answered the same query in 1.35 seconds. The mechanism has since been instrumented (EXPLAIN diagnostic, 2026-06-10): with no column statistics on the native table, the engine's greedy join reordering chose a plan with a measured 1.2-billion-row intermediate, and with the reordering disabled the same query answered in 5.3 seconds. The follow-up closed it: materializing statistics on the six tables (one ALTER TABLE command, ~22 s) flips the plan and the same query answers in 0.675 seconds on default settings — a reminder that full join support and predictable join planning are different properties, and that the gap between them can be one maintenance command nobody told you to run.
When to choose which
ClickHouse is the call when the engine has to serve more than security (observability, security, and business analytics on one platform), when complex SQL joins are part of the work, when you can live with schema optimization as a tax, and when Iceberg and lakehouse integration plus a mature ecosystem matter. Hydrolix earns the slot in the narrower world where the workload is 100% logs, cardinality is extreme (millions of unique IPs, usernames, or hashes a day), deeply nested JSON has to survive without flattening, query performance can't dip during ingestion spikes, and cost-effective long-term retention is the point of the exercise. The two lists barely overlap, and that's what makes the choice tractable, because you're matching the engine to the shape of the workload rather than running a head-to-head.
One asymmetry decides where I'd land by default. ClickHouse has Netflix at 5 PB/day and Huntress at 3 million endpoints as Tier A production validation. Hydrolix's architectural claims are reasonable and I haven't found them contradicted, but I also haven't found a public petabyte-scale case study to put behind them, so I hold them at Tier C. Until that evidence exists, default to ClickHouse for production decisions and reserve Hydrolix for the genuinely log-only, nested-structure-heavy case it was built for.
Decision framework
Should you migrate?
The short version is below; for how these conditions weigh against each other under a specific environment archetype, see the worked scorecard, where the same engine scores differently depending on whether latency or cost is the design center.
Use ClickHouse if
- Collecting over 5 TB/day (or will be soon).
- Analysts run aggregation queries (counts, groupings, time-series).
- Need sub-second query response for investigations.
- Have engineering capacity to operate infrastructure (ClickHouse isn't push-button).
- Data is structured or semi-structured (JSON logs, not binary blobs).
Stick with traditional SIEM if
- Under 1 TB/day and budget isn't a constraint.
- Heavily rely on out-of-the-box detection rules and dashboards.
- Team prefers managed services.
- Need full-text search across unstructured data.
Consider DuckDB if
- Need ClickHouse-like performance but at smaller scale (10s of GB to TBs, not PBs).
- Want edge analytics (queries run where data lives, not centralized).
- Team is familiar with SQL but not distributed databases.
Jake Thomas at Okta runs DuckDB at 7.5 trillion records for security analytics, a different architecture reaching comparable scale.
I've since put this decision on a measured footing rather than leaving it to brochure claims. In a
runnable open-lakehouse stack I stood up, the same OCSF data loaded into the lakehouse and into an
OpenSearch schema-on-read SIEM returned identical answers, with the lakehouse holding it
in roughly 7× less storage than the SIEM's index. The needle case is the one I want to
be precise about, because the lazy version of this claim is "the index wins point lookups and the
lakehouse wins scans," and the measured result is sharper than that. On a random single-row lookup
(uid = <one row>) over a 10M-row Zeek conn corpus, OpenSearch's inverted index returned in
3.5 ms and ClickHouse over the unsorted Iceberg table took 145 ms, a 41× gap that
looks like a structural lakehouse weakness right up until you query a ClickHouse-native MergeTree table
sorted on the lookup columns, which answered the same needle in 3.5 ms too — a tie with the index, not a
loss. So the point-lookup penalty isn't the lakehouse versus the index; it's an unsorted layout
versus a sorted one, and both the inverted index and a sorted primary index serve these lookups in 3–5 ms
while the unsorted full-scan is what loses by 9–41×. That makes the two-regime claim symmetric: the
columnar scan wins the heavy hunting aggregations, an index-or-sorted layout wins the cheap point lookups,
and the lakehouse's lookup weakness is a layout choice (a sort or Z-order on the looked-up columns) rather
than a limit of the format. The one half I haven't measured is BM25 fuzzy full-text, which is the other
piece of the index's home turf, and I've left it as future work because the Zeek conn corpus has no rich
text field for a fair test. And because a fast answer is worthless if it's wrong, the stack
cross-checks five independent engines (DuckDB, Trino, ClickHouse, StarRocks, Dremio) returning the same
answer over the same Iceberg table before any latency is trusted, and the per-workload winner among them
turns out to be a property of scale and concurrency that a single host doesn't surface. These needle
numbers are Tier B, one host, on OpenSearch 3.7.0, so re-check them on the next release, but they
are what puts the decision framework above on a measured footing rather than brochure claims.
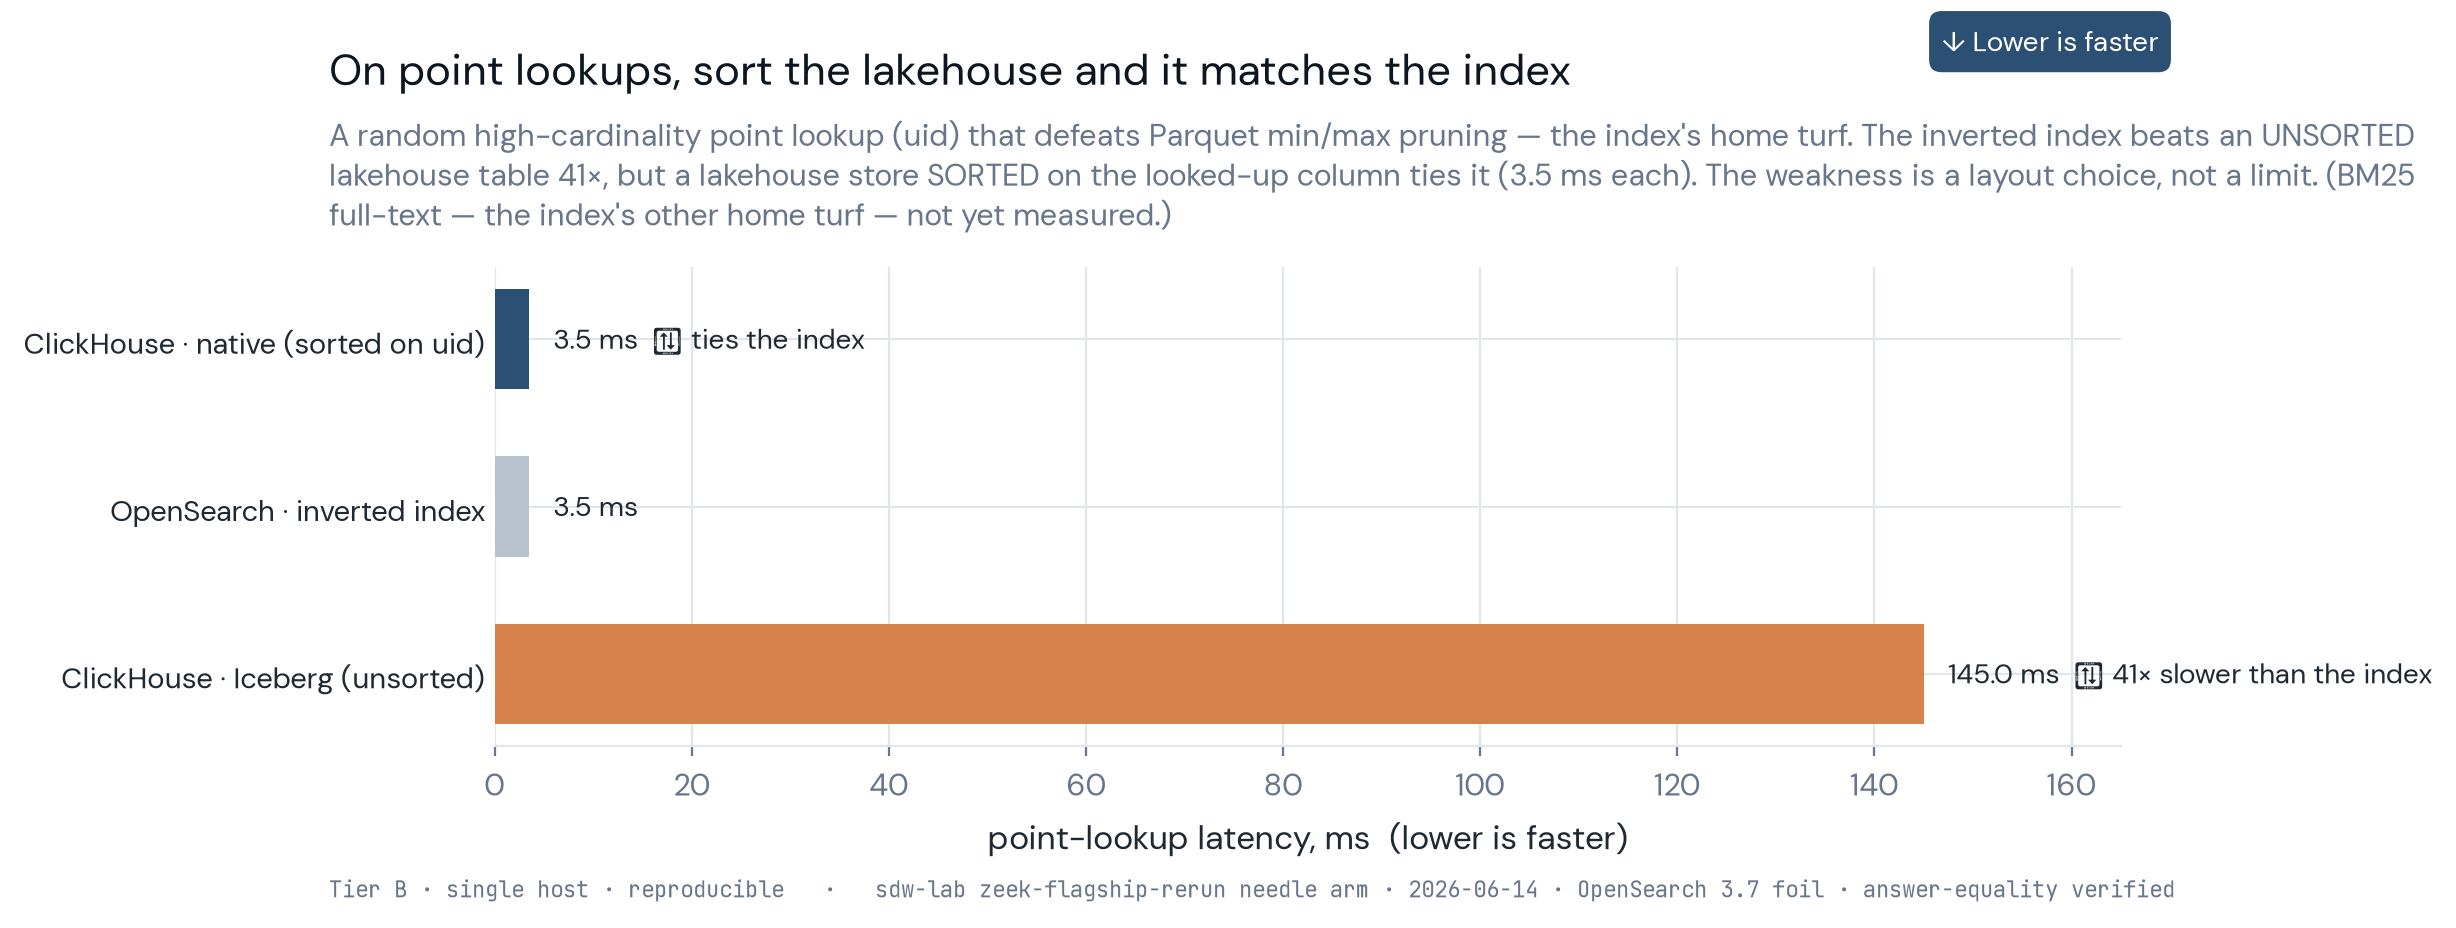
uid) — the inverted index and a lakehouse store sorted on the looked-up column both answer in 3.5 ms; only the unsorted Iceberg scan loses, by 41× (Tier B, single host, OpenSearch 3.7.0; BM25 full-text not yet measured).
Takeaways
What Netflix's scale teaches security architects.
Netflix didn't publish its logging optimizations to be generous. It published them because they validate a pattern the observability and security worlds are both converging on from opposite directions: a columnar engine over lakehouse storage now does the job a schema-on-read SIEM used to, at petabyte scale, for a fraction of the bill. Four things from this piece are worth carrying out of it.
- The performance and cost gap is large but workload-dependent, so anchor it to a measurement rather than a banner. The cleanest number in this essay is Huntress's: 93% off the bill, terabytes compressing 20–50×, sub-second queries where Elastic took 30 seconds. The cost table puts that at roughly 2–4× under Elastic and up to 27× under a schema-on-read SIEM at 5 TB/day, though your own multiplier depends on how column-narrow your queries are.
- Optimize at the three points that actually bind. Parsing: generated lexers beat regex (216 µs → 23 µs). Write path: a native protocol beats JDBC at high event rates. Query path: data layout beats clever query rewriting (tag sharding, 3 s → 700 ms).
- Tiering stops being optional once cold data is the majority of your volume. Keep hot data fast, age cold data to Iceberg, and put one read contract over both so the analyst never sees the seam.
- Scale changes which decisions are premature. Choices you can defer at 1 TB/day are mandatory at 100 TB/day, and Netflix's organizing principle, "do the least amount of work" per query, is the one that survives the jump.
The part I keep coming back to is how little of this is novel research. Designing a security data platform at this scale today is mostly reading what Netflix already wrote down, confirming Huntress paid the bills it claims to have paid, and copying the parts that fit your workload.
The edge this sits on
Edge: the distributed-cluster regime these deployments run in starts past the lab's measured range — the lab's last coordinate is the shape-dependent single-node ceiling between 100M and 1B rows, which is why this essay leans on named production deployments rather than lab numbers.
Signal: you're approaching that ceiling from below when your slowest routine query's p95 grows faster than your hot table's row count over two quarters — the edge is graceful, so the tail warns you quarters ahead.
Caveat: lab coordinates are one host, Tier B; what travels is ordering and shape. Locate yourself on the breaking-points map with your own numbers.